 6
6peptides
spectra
0.000 | 0.000
0.961 | 0.982
0.000 | 0.000
0.000 | 0.000
0.000 | 0.000
0.000 | 0.000
0.016 | 0.038
0.000 | 0.000
| Plot | Mito | Lyso | Perox | ER | Golgi | PM | Cytosol | Nucleus | |||||
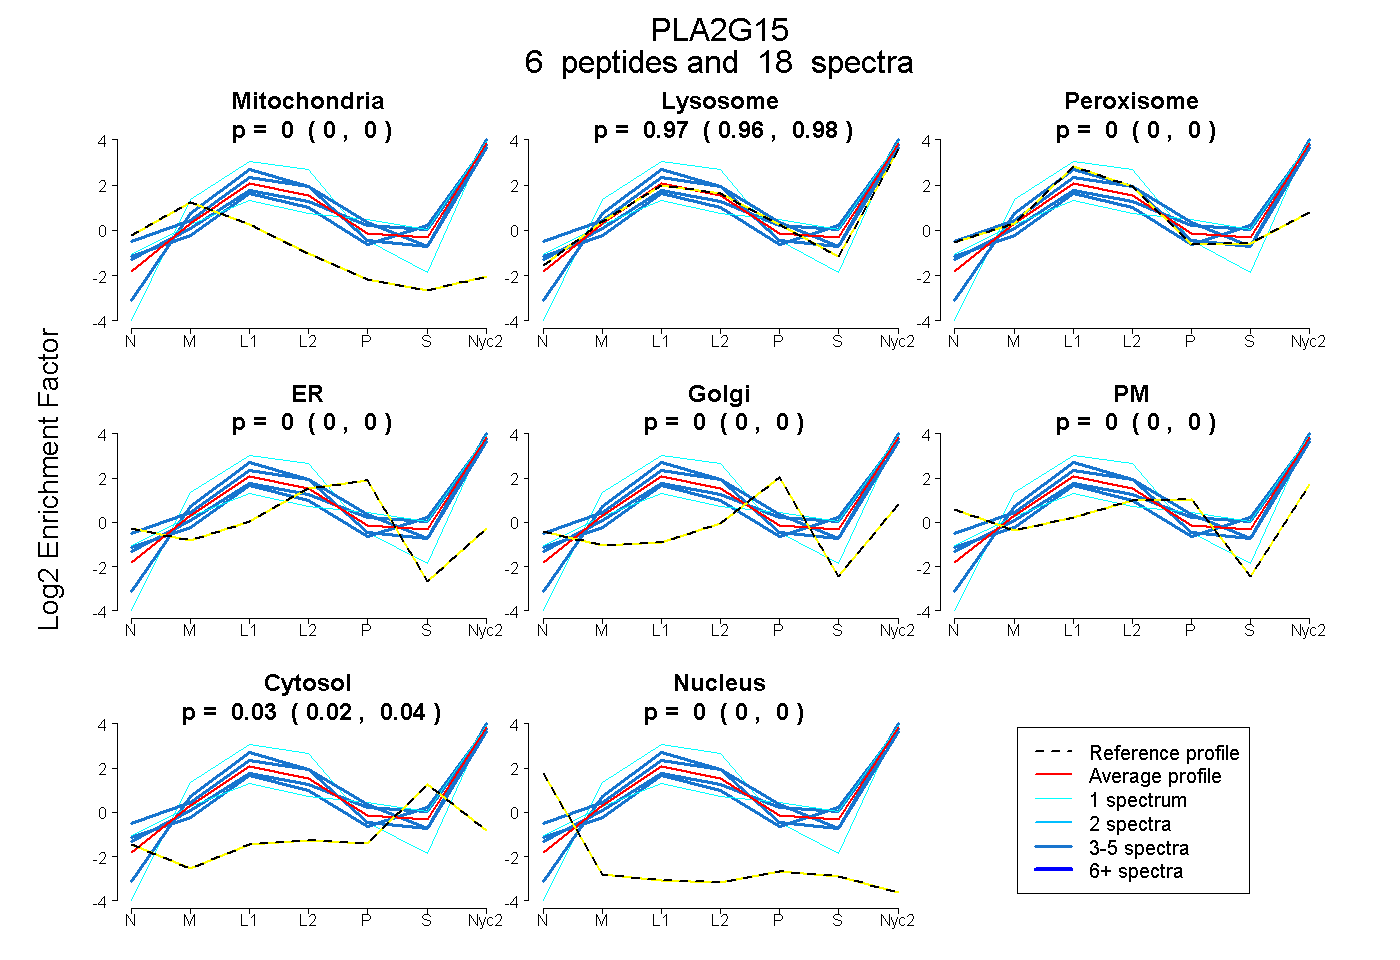
| Expt A |
6 peptides |
18 spectra |
|
0.000 0.000 | 0.000 |
0.972 0.961 | 0.982 |
0.000 0.000 | 0.000 |
0.000 0.000 | 0.000 |
0.000 0.000 | 0.000 |
0.000 0.000 | 0.000 |
0.028 0.016 | 0.038 |
0.000 0.000 | 0.000 |
| 3 spectra, VVHYLCSK | 0.000 | 0.865 | 0.125 | 0.000 | 0.000 | 0.009 | 0.000 | 0.000 | ||
| 5 spectra, QPQAWK | 0.000 | 0.917 | 0.000 | 0.000 | 0.000 | 0.000 | 0.083 | 0.000 | ||
| 4 spectra, IPVIGPLK | 0.000 | 1.000 | 0.000 | 0.000 | 0.000 | 0.000 | 0.000 | 0.000 | ||
| 1 spectrum, VLLEEP | 0.000 | 0.886 | 0.000 | 0.000 | 0.000 | 0.000 | 0.114 | 0.000 | ||
| 4 spectra, TTQFPDGVDVR | 0.000 | 0.847 | 0.000 | 0.000 | 0.000 | 0.000 | 0.153 | 0.000 | ||
| 1 spectrum, FFQDIGFEDGWFMR | 0.000 | 1.000 | 0.000 | 0.000 | 0.000 | 0.000 | 0.000 | 0.000 |
| Plot | Mito | Lyso or Perox | ER | Golgi | PM | Cytosol | Nucleus | ||||||
| Expt B |
3 peptides |
7 spectra |
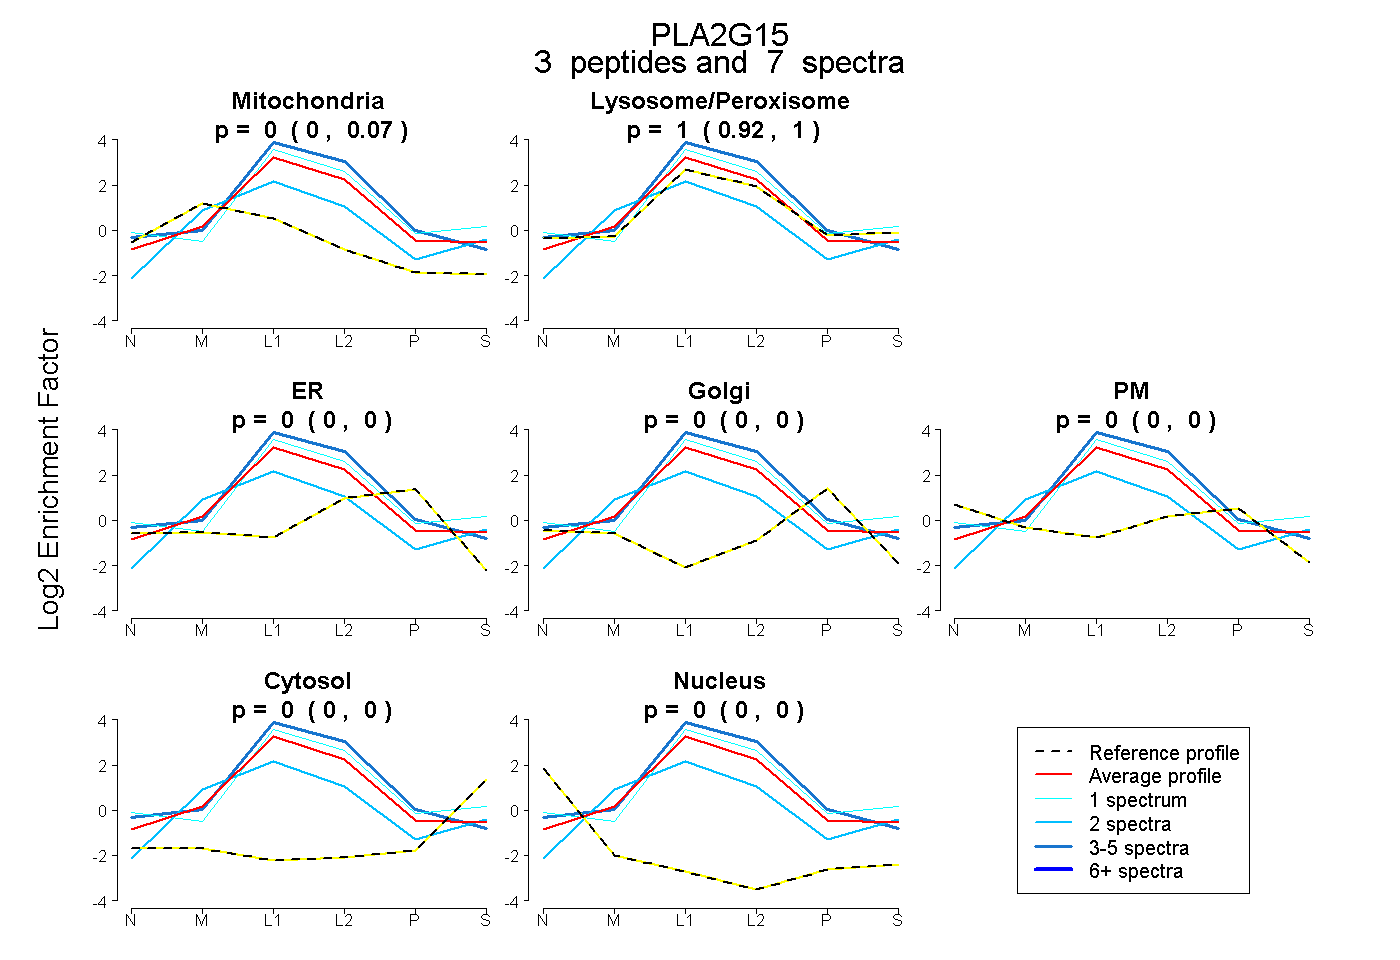 |
0.000 0.000 | 0.072 |
1.000 0.917 | 1.000 |
0.000 0.000 | 0.000 |
0.000 0.000 | 0.000 |
0.000 0.000 | 0.000 |
0.000 0.000 | 0.000 |
0.000 0.000 | 0.000 |
|||
| Plot | Lyso | Other | |||||||||||
| Expt C |
9 peptides |
119 spectra |
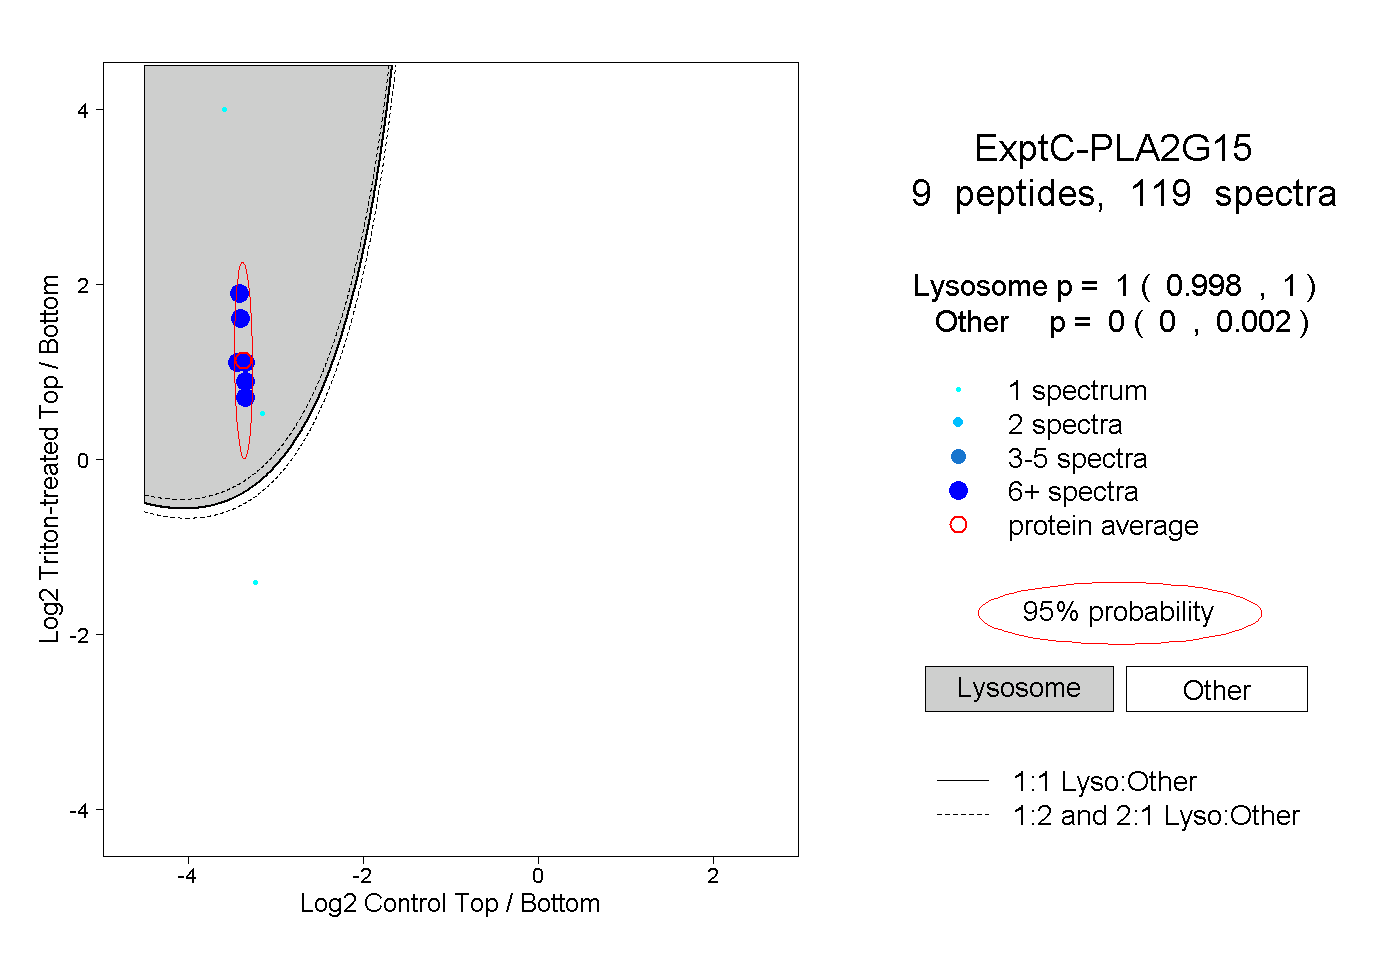 |
1.000 0.998 | 1.000 |
0.000 0.000 | 0.002 |
||||||||
| Plot | Lyso | Other | |||||||||||
| Expt D |
4 peptides |
11 spectra |
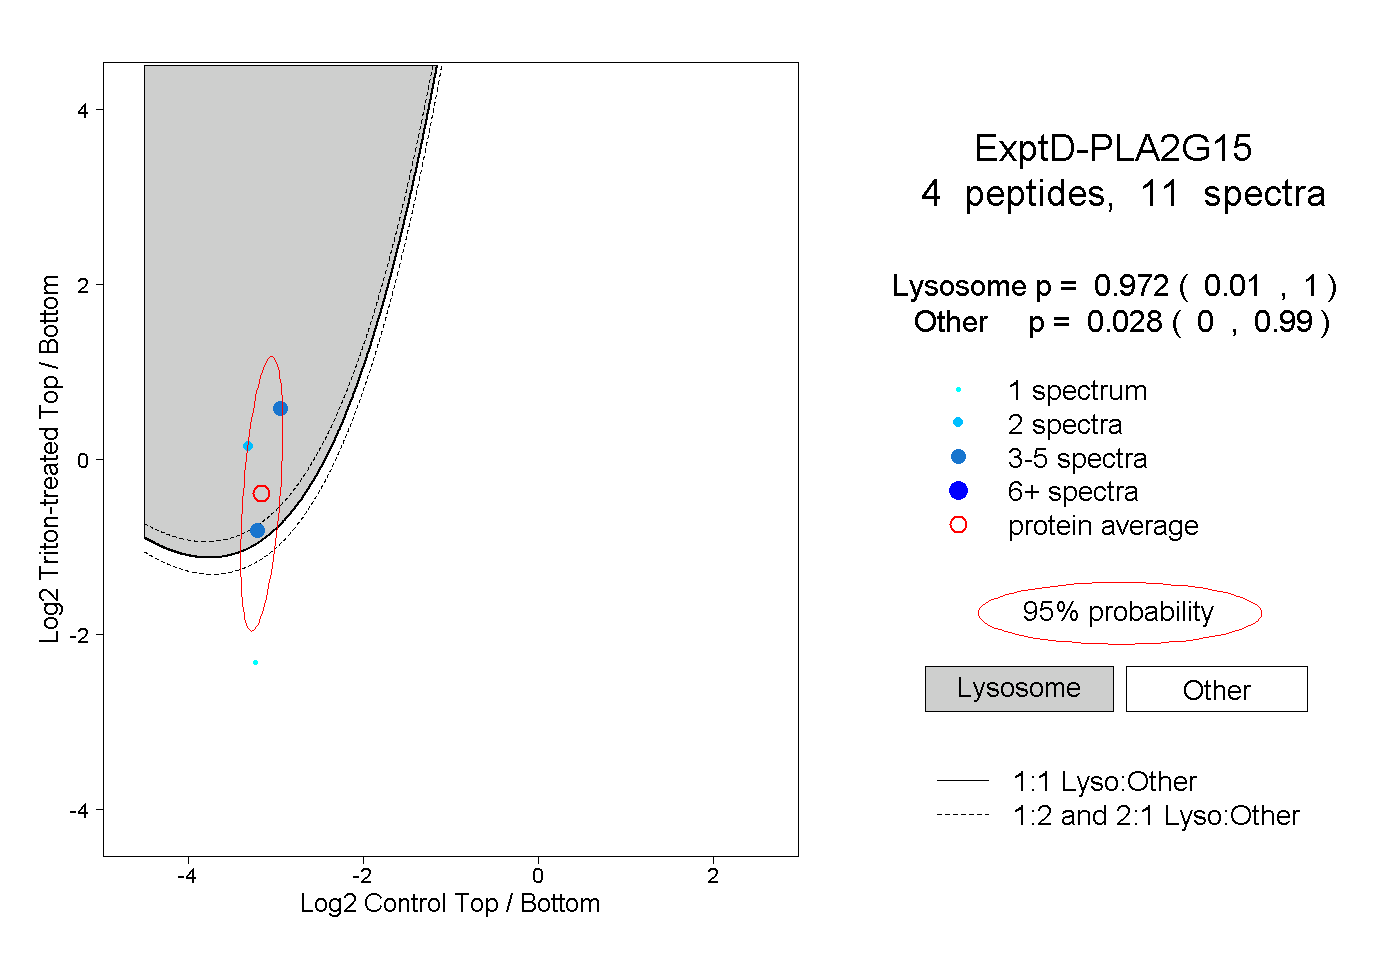 |
0.972 0.010 | 1.000 |
0.028 0.000 | 0.990 |