 3
3peptides
spectra
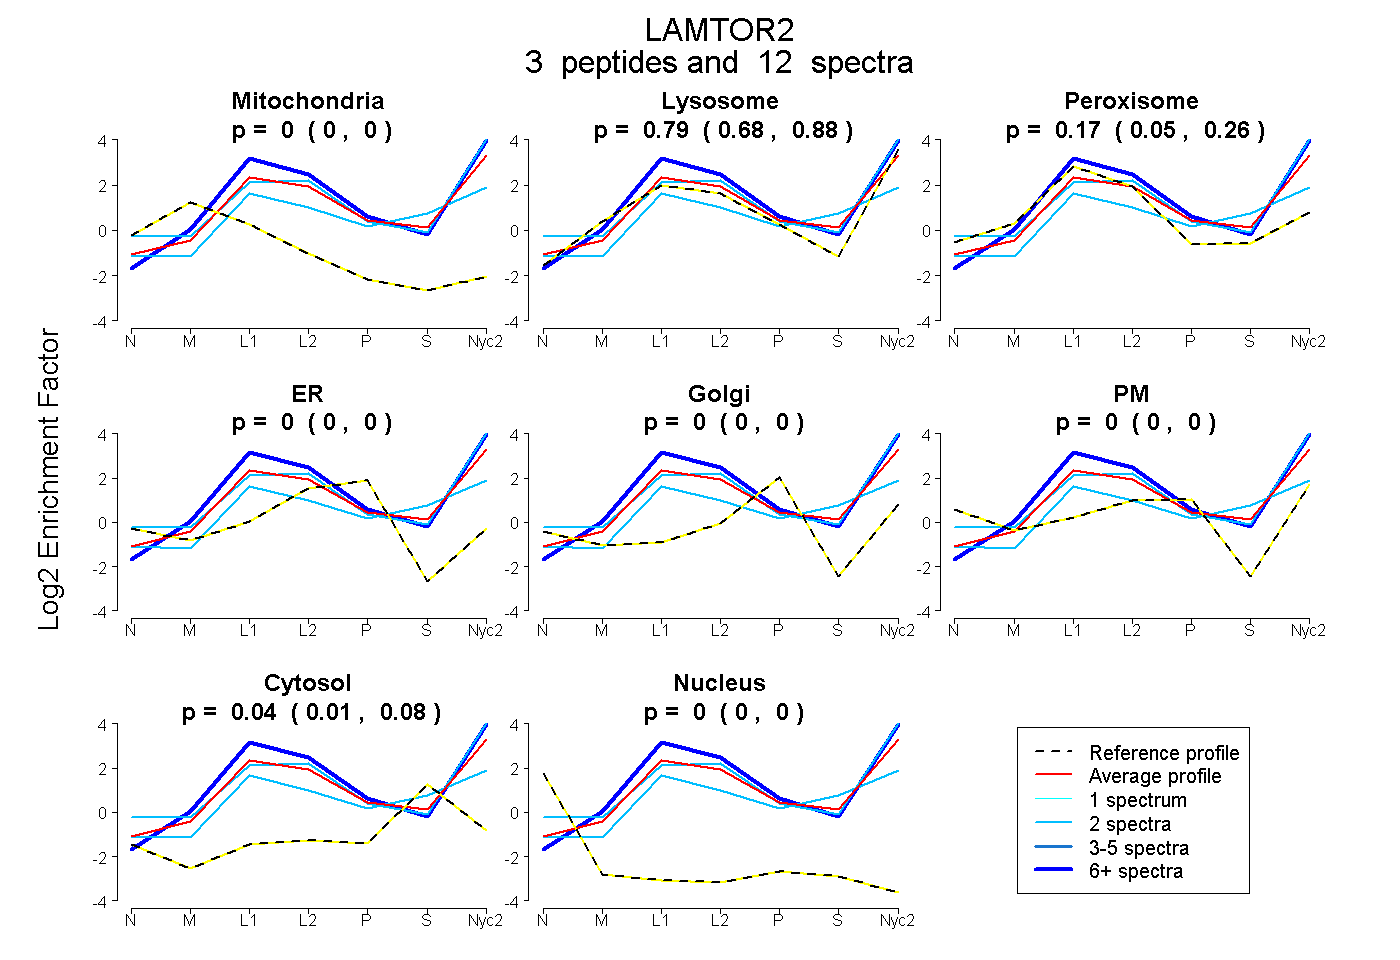
0.000 | 0.000
0.679 | 0.878
0.054 | 0.259
0.000 | 0.000
0.000 | 0.000
0.000 | 0.000
0.009 | 0.075
0.000 | 0.000
5peptides
spectra
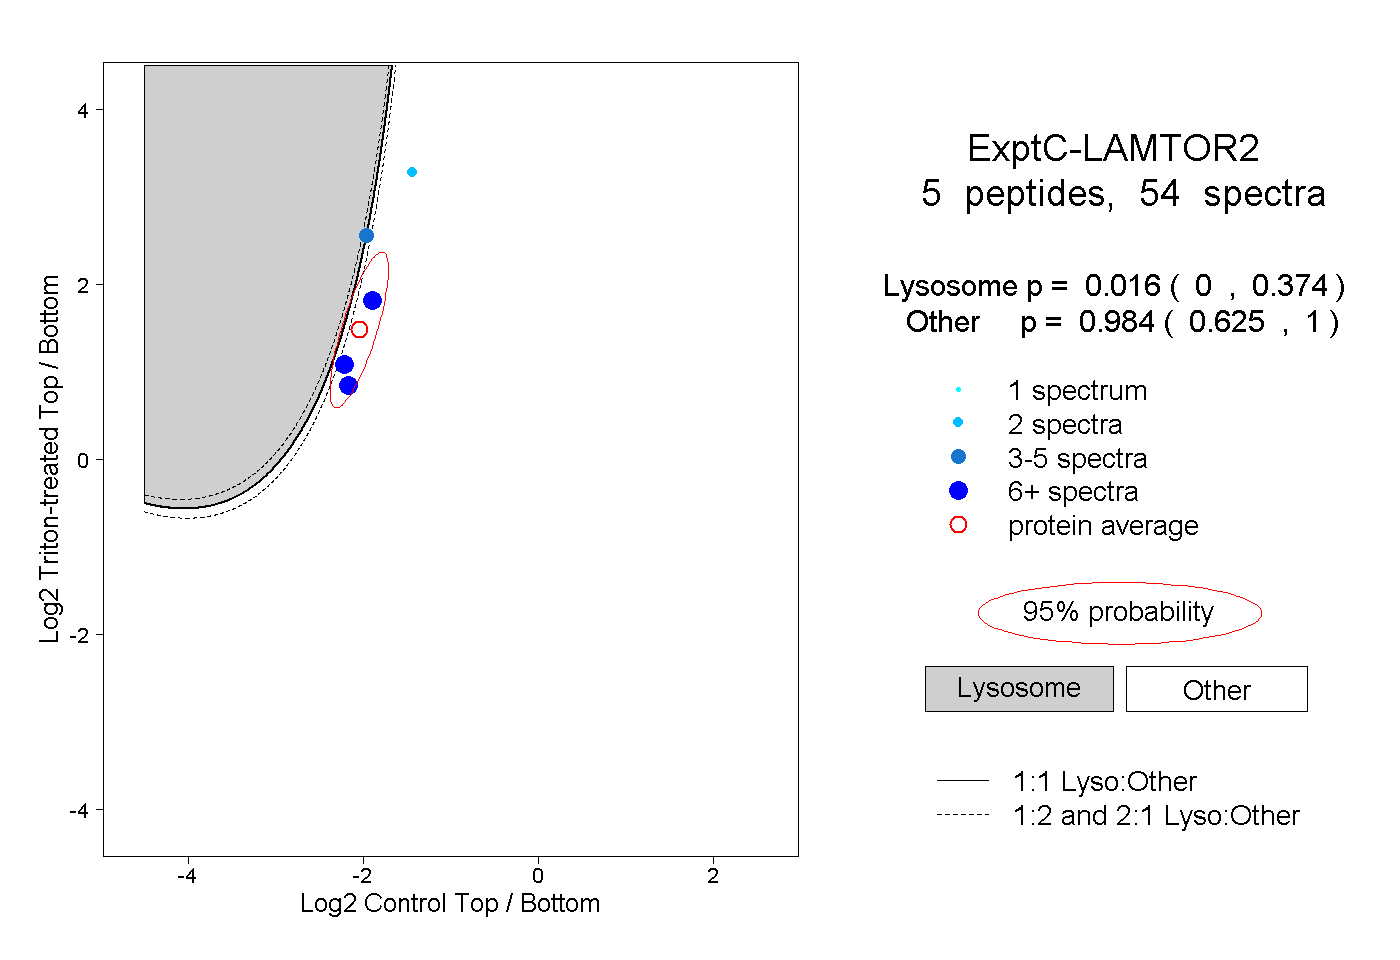
0.000 | 0.374
0.625 | 1.000
1peptide
spectrum
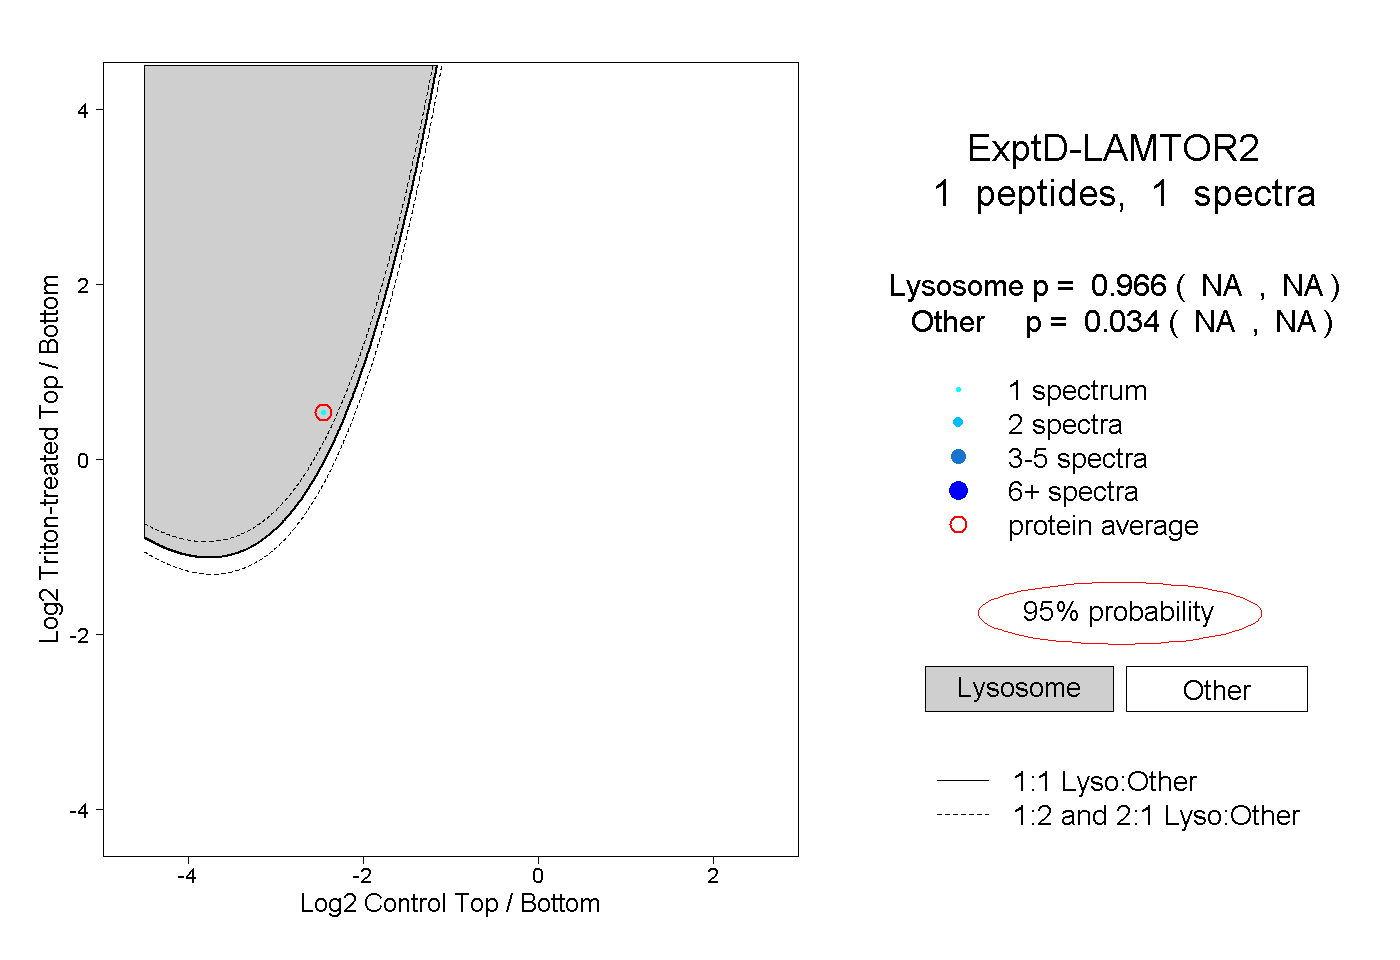
NA | NA
NA | NA