 3
3peptides
spectra
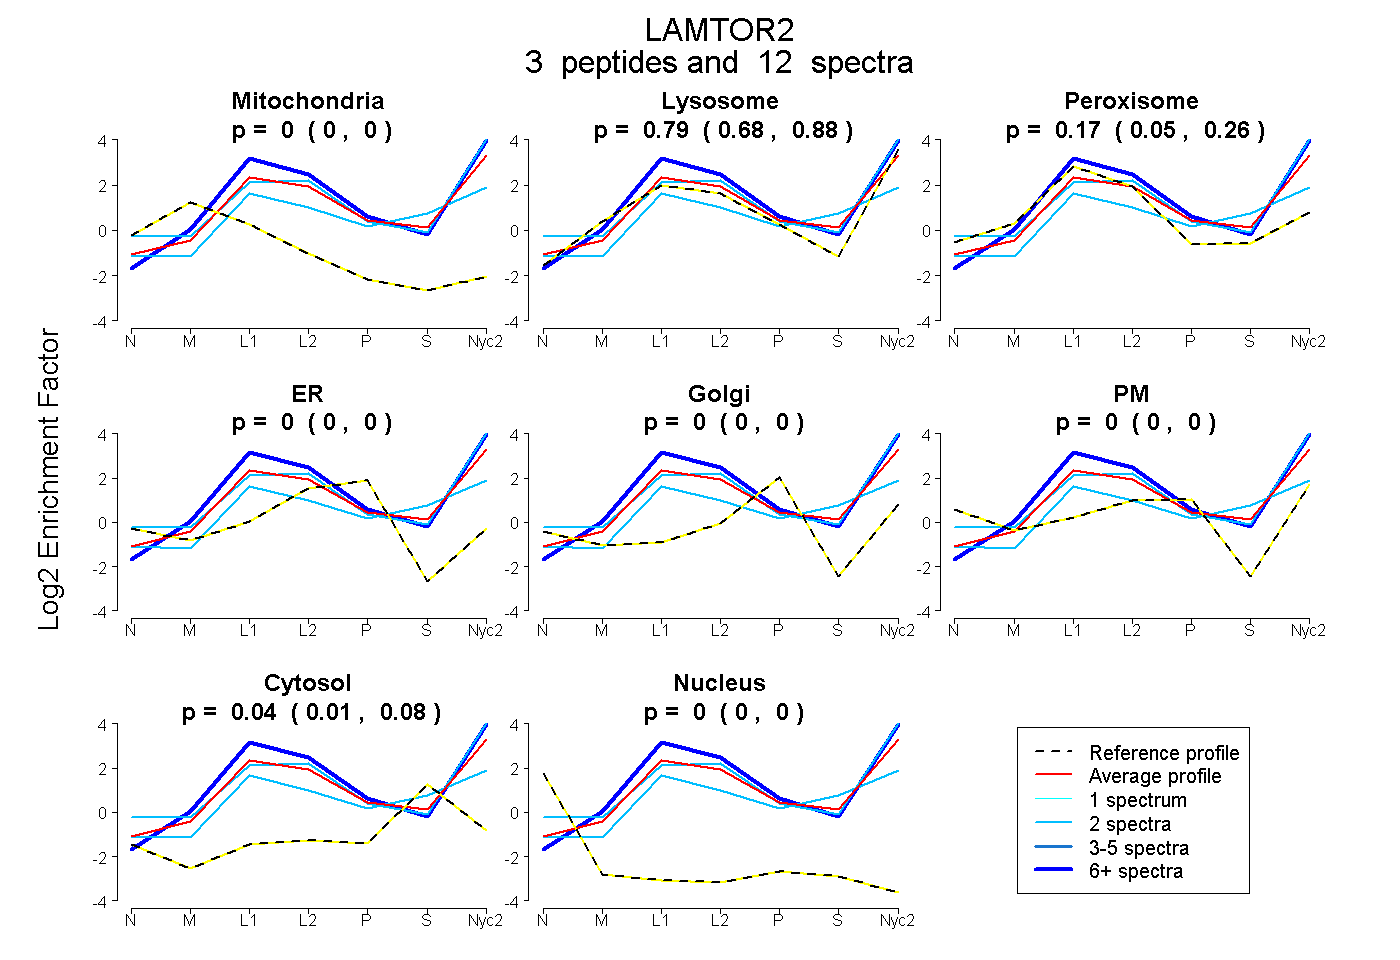
0.000 | 0.000
0.679 | 0.878
0.054 | 0.259
0.000 | 0.000
0.000 | 0.000
0.000 | 0.000
0.009 | 0.075
0.000 | 0.000
| Plot | Mito | Lyso | Perox | ER | Golgi | PM | Cytosol | Nucleus | |||||
| Expt A |
3 peptides |
12 spectra |
|
0.000 0.000 | 0.000 |
0.791 0.679 | 0.878 |
0.167 0.054 | 0.259 |
0.000 0.000 | 0.000 |
0.000 0.000 | 0.000 |
0.000 0.000 | 0.000 |
0.042 0.009 | 0.075 |
0.000 0.000 | 0.000 |
| 8 spectra, FILMDCMEGR | 0.000 | 0.979 | 0.021 | 0.000 | 0.000 | 0.000 | 0.000 | 0.000 | ||
| 2 spectra, VANLLLCMYAK | 0.000 | 0.473 | 0.228 | 0.000 | 0.000 | 0.000 | 0.299 | 0.000 | ||
| 2 spectra, NGNQAFNEDSLK | 0.000 | 0.904 | 0.085 | 0.000 | 0.000 | 0.011 | 0.000 | 0.000 |
| Plot | Lyso | Other | |||||||||||
| Expt C |
5 peptides |
54 spectra |
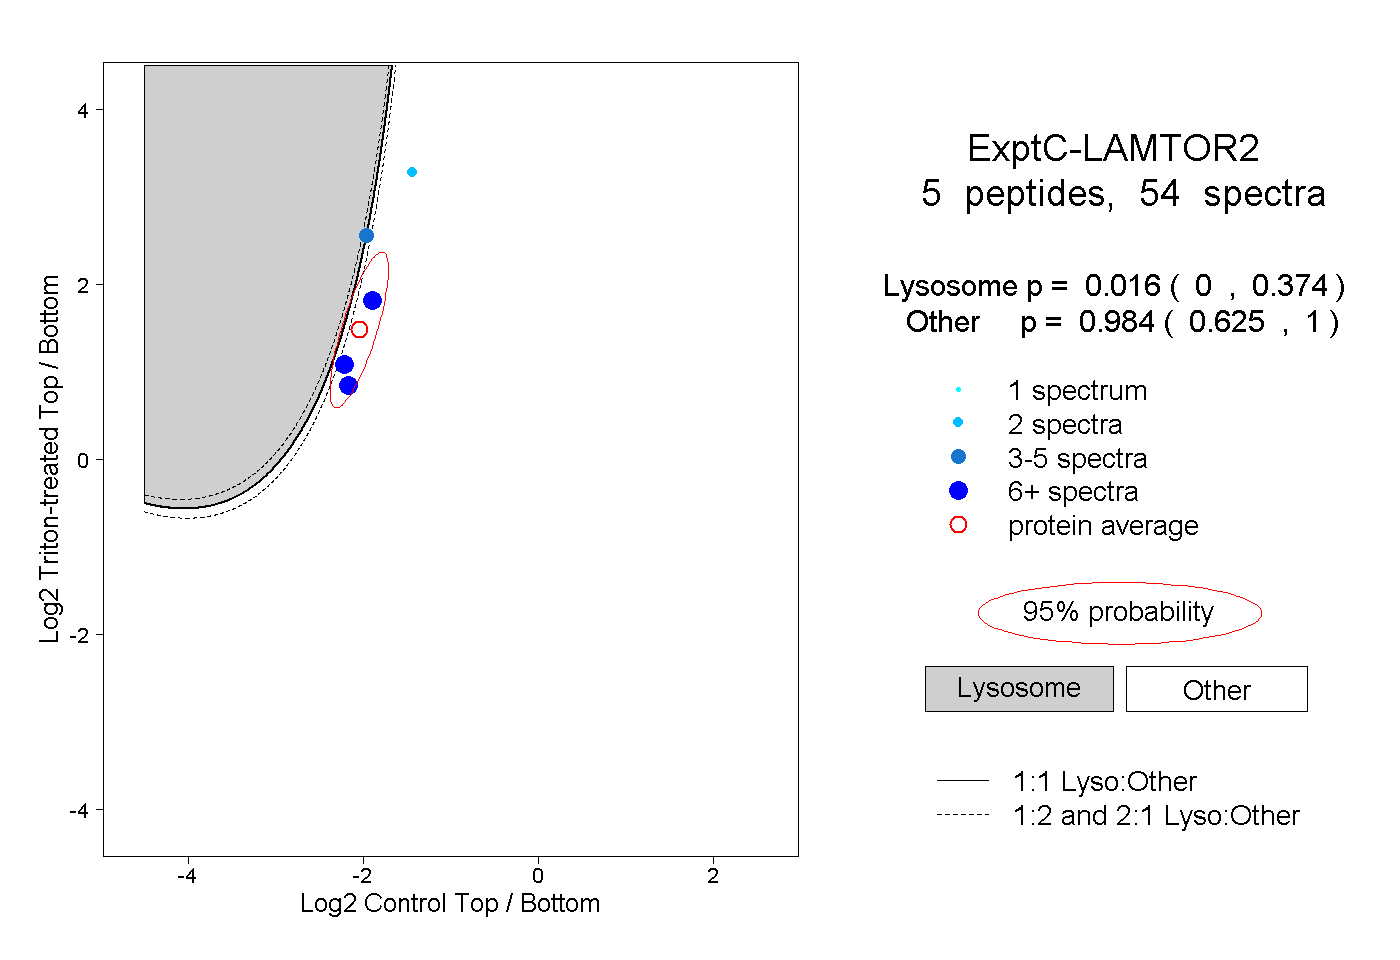 |
0.016 0.000 | 0.374 |
0.984 0.625 | 1.000 |
||||||||
| Plot | Lyso | Other | |||||||||||
| Expt D |
1 peptide |
1 spectrum |
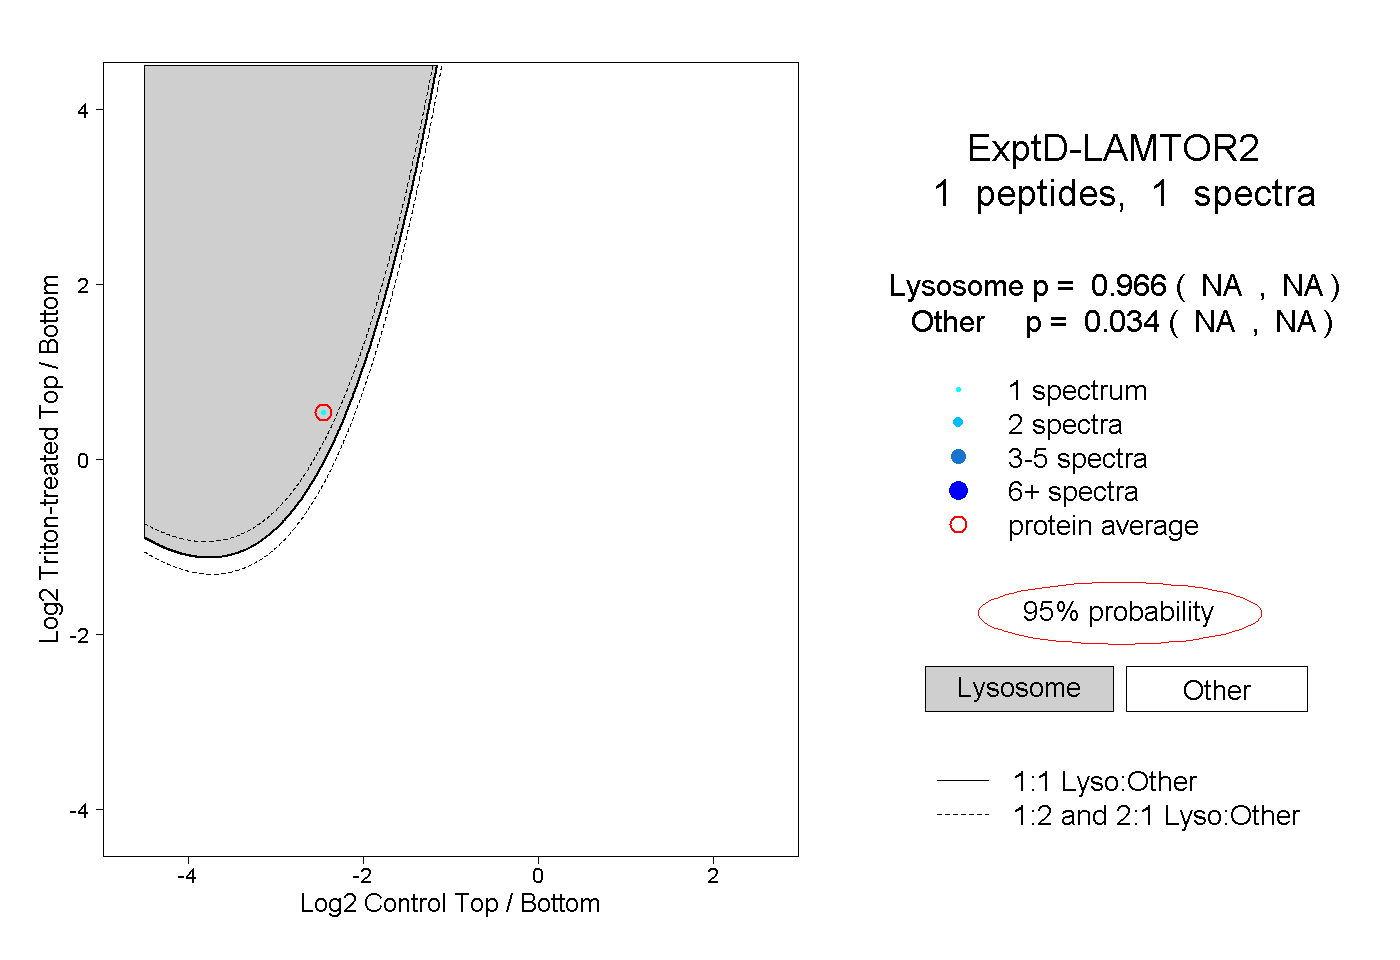 |
0.966 NA | NA |
0.034 NA | NA |