 32
32peptides
spectra
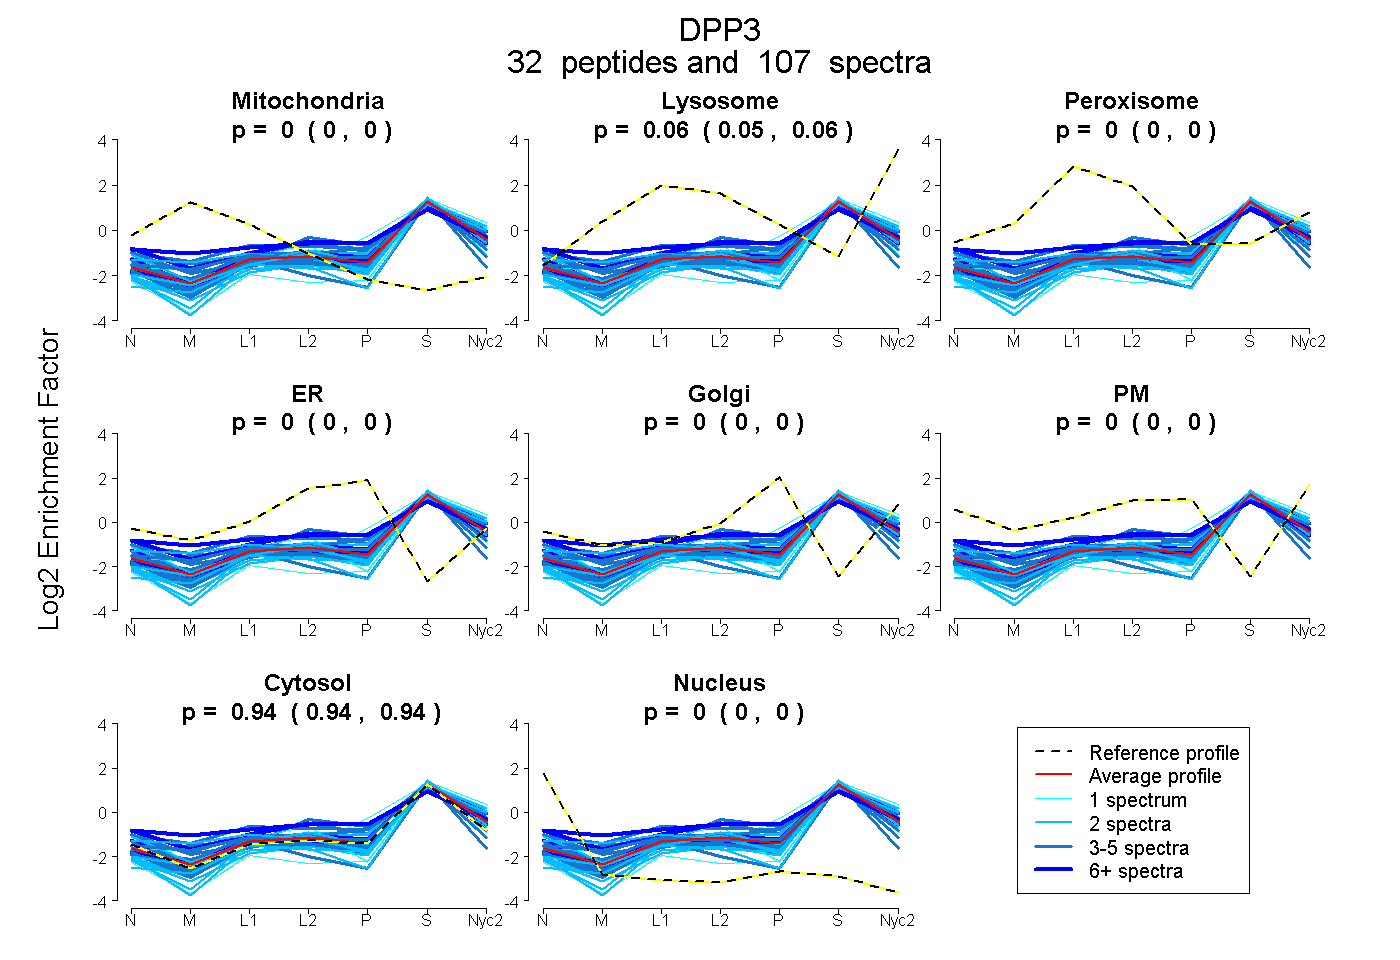
0.000 | 0.000
0.055 | 0.058
0.000 | 0.000
0.000 | 0.000
0.000 | 0.000
0.000 | 0.000
0.941 | 0.945
0.000 | 0.000
16peptides
spectra
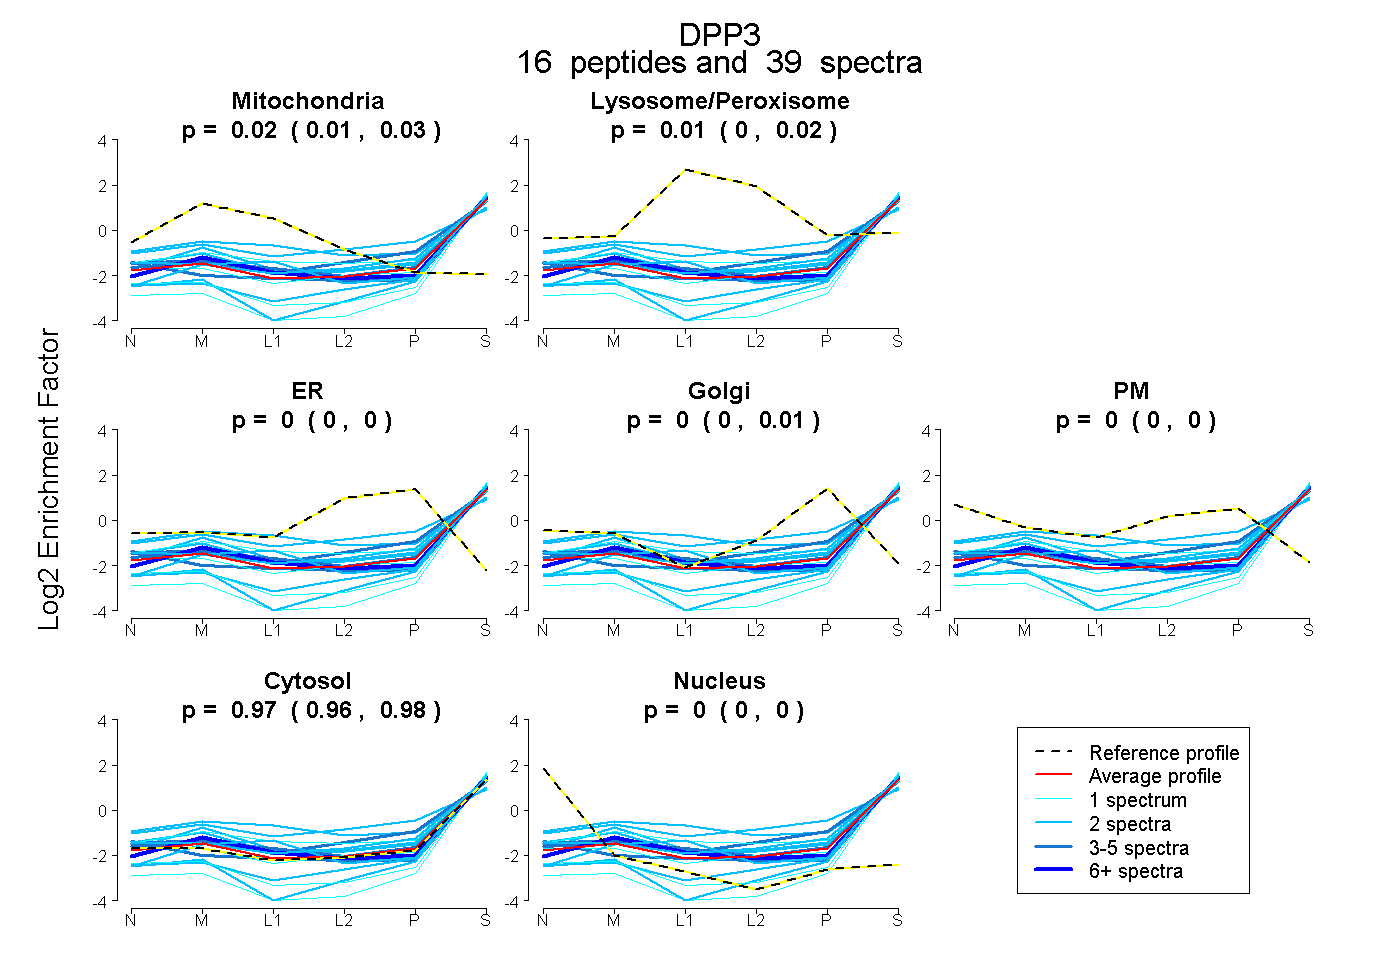
0.006 | 0.026
0.000 | 0.020
0.000 | 0.000
0.000 | 0.005
0.000 | 0.000
0.962 | 0.978
0.000 | 0.000
29peptides
spectra
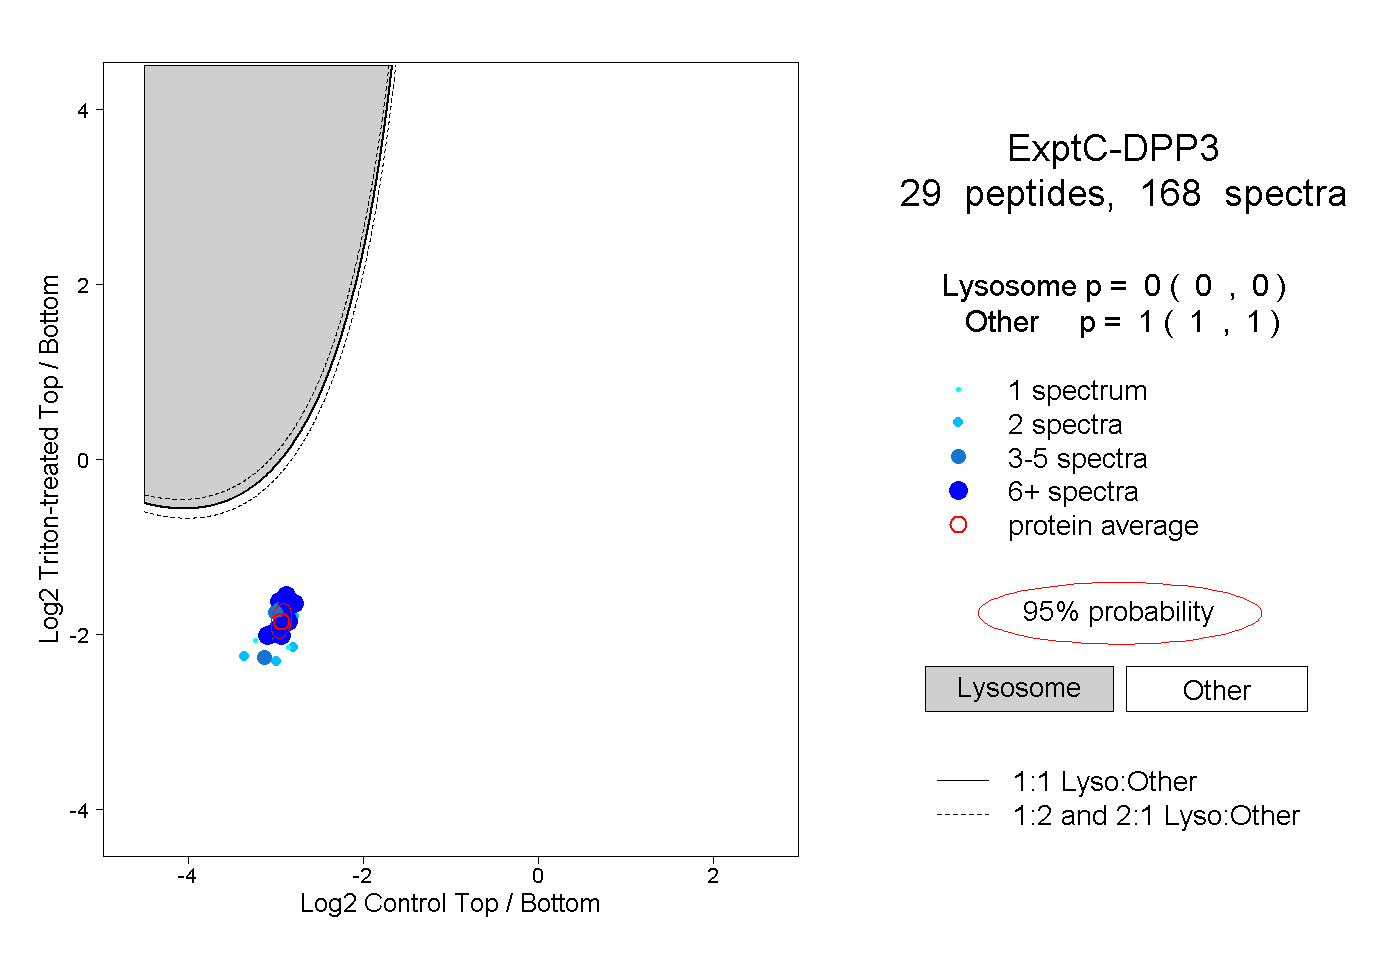
0.000 | 0.000
1.000 | 1.000
4peptides
spectra
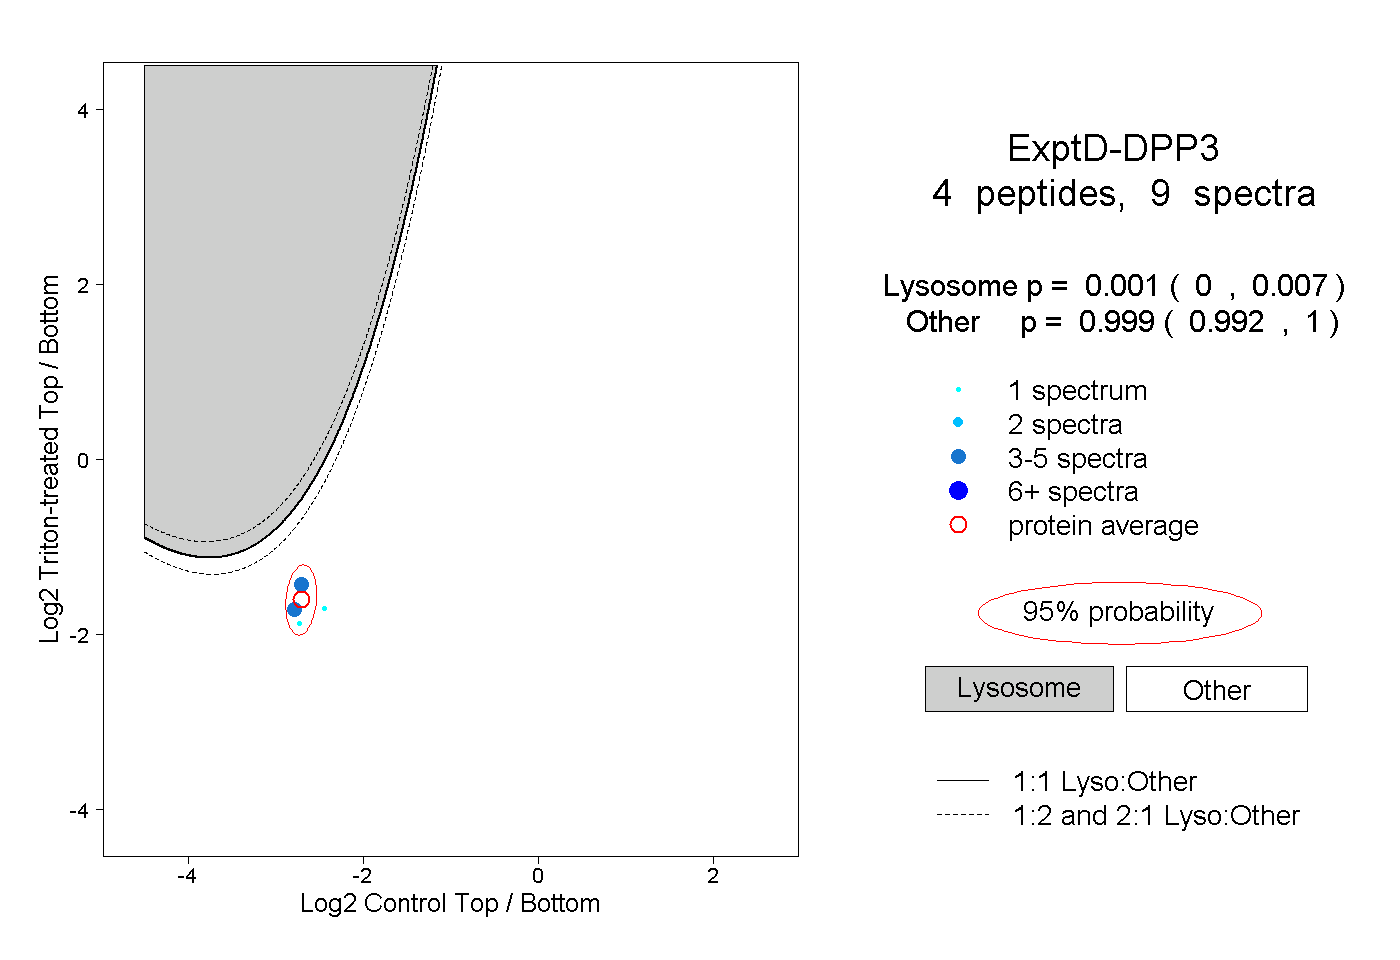
0.000 | 0.007
0.992 | 1.000