 7
7peptides
spectra
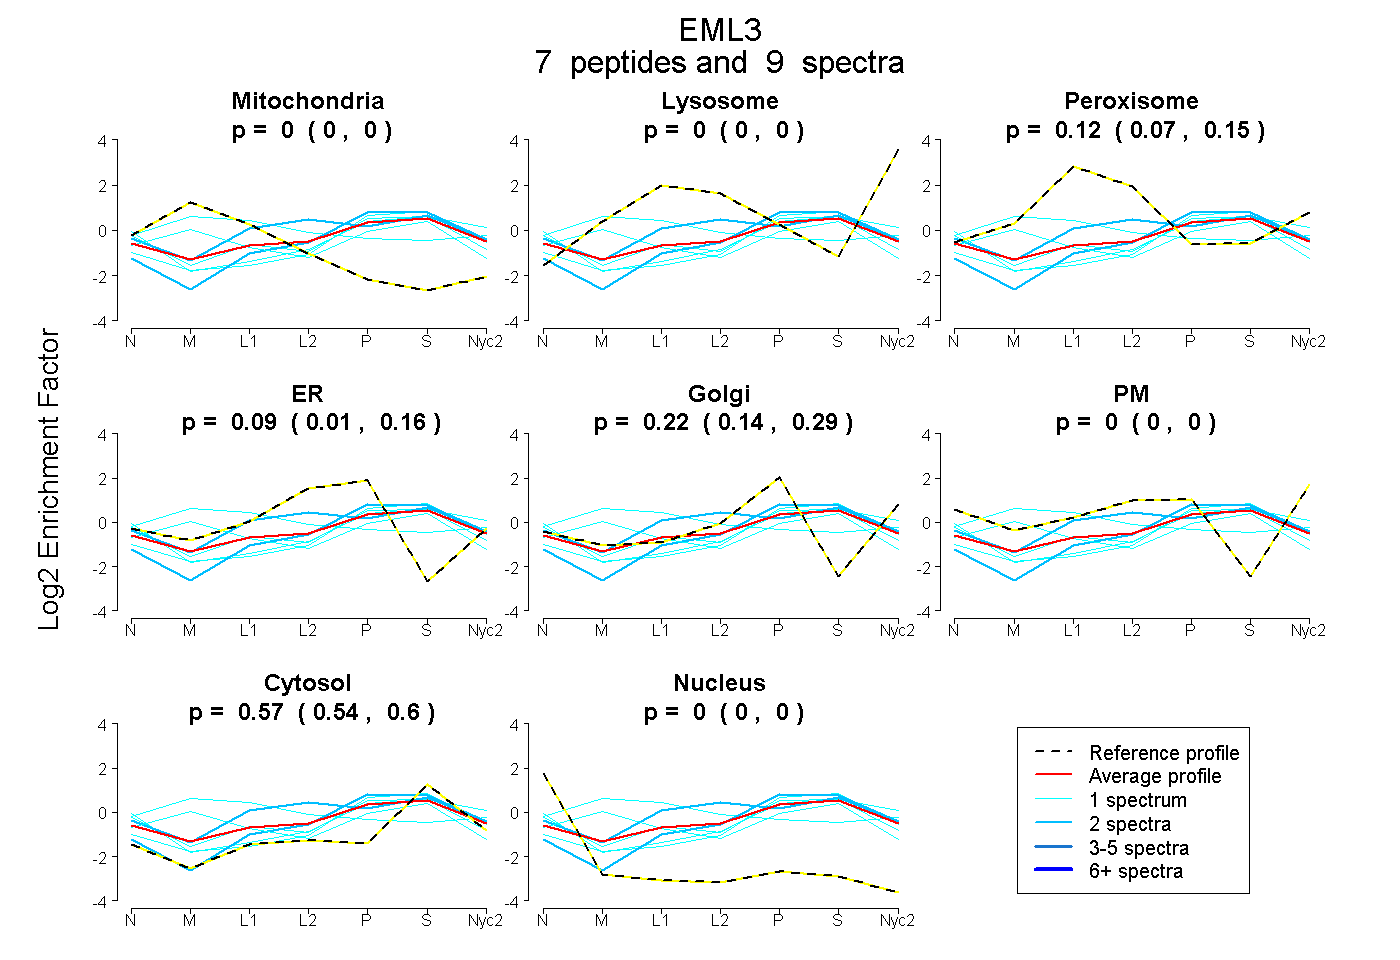
0.000 | 0.000
0.000 | 0.000
0.073 | 0.151
0.010 | 0.159
0.143 | 0.287
0.000 | 0.000
0.541 | 0.596
0.000 | 0.000
2peptides
spectra
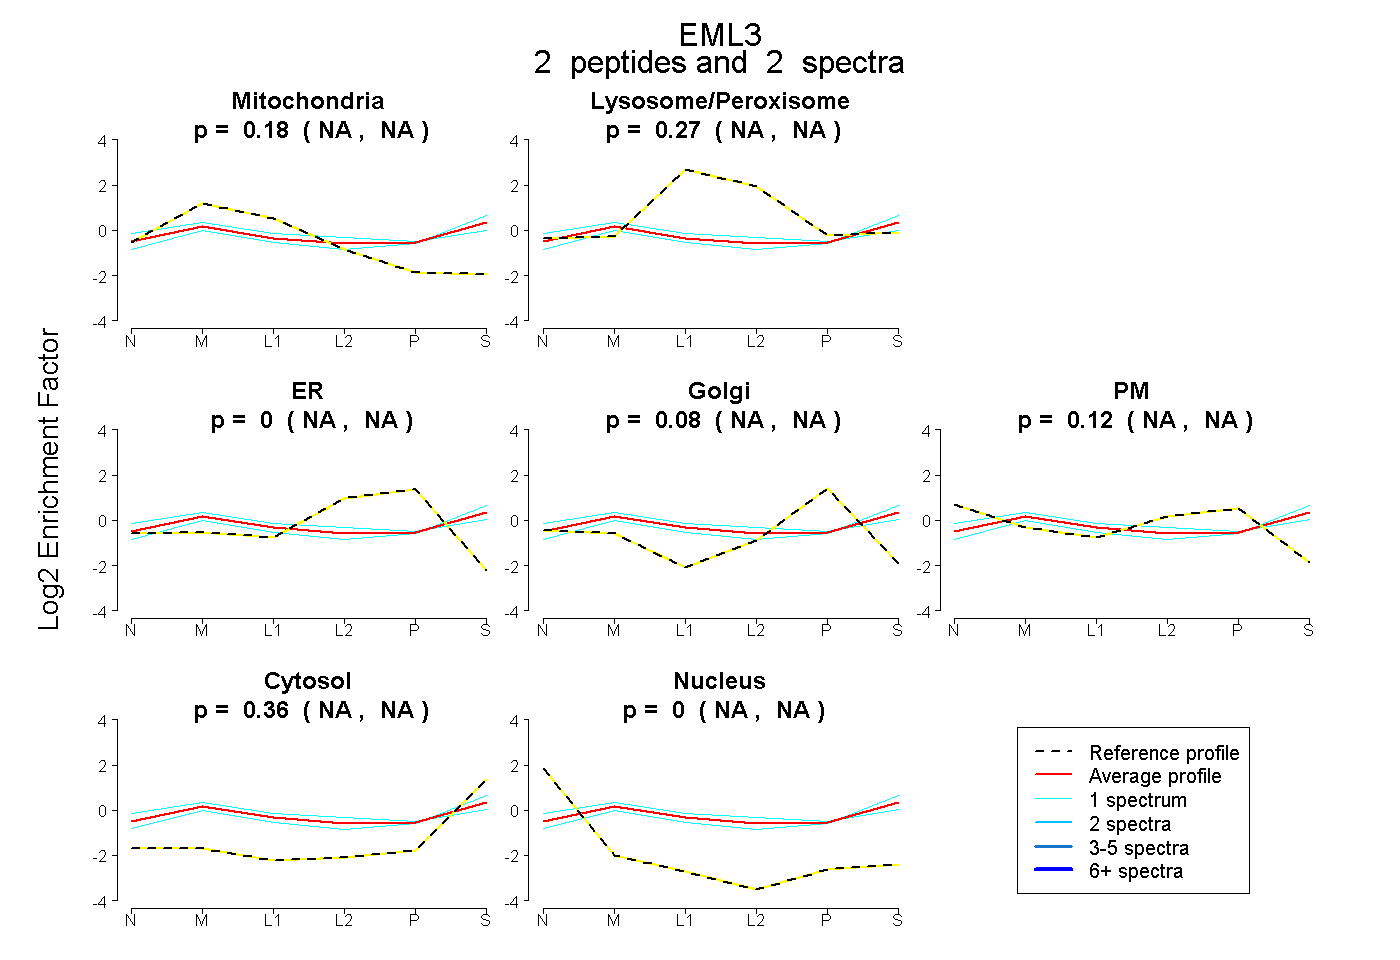
NA | NA
NA | NA
NA | NA
NA | NA
NA | NA
NA | NA
NA | NA
1peptide
spectra
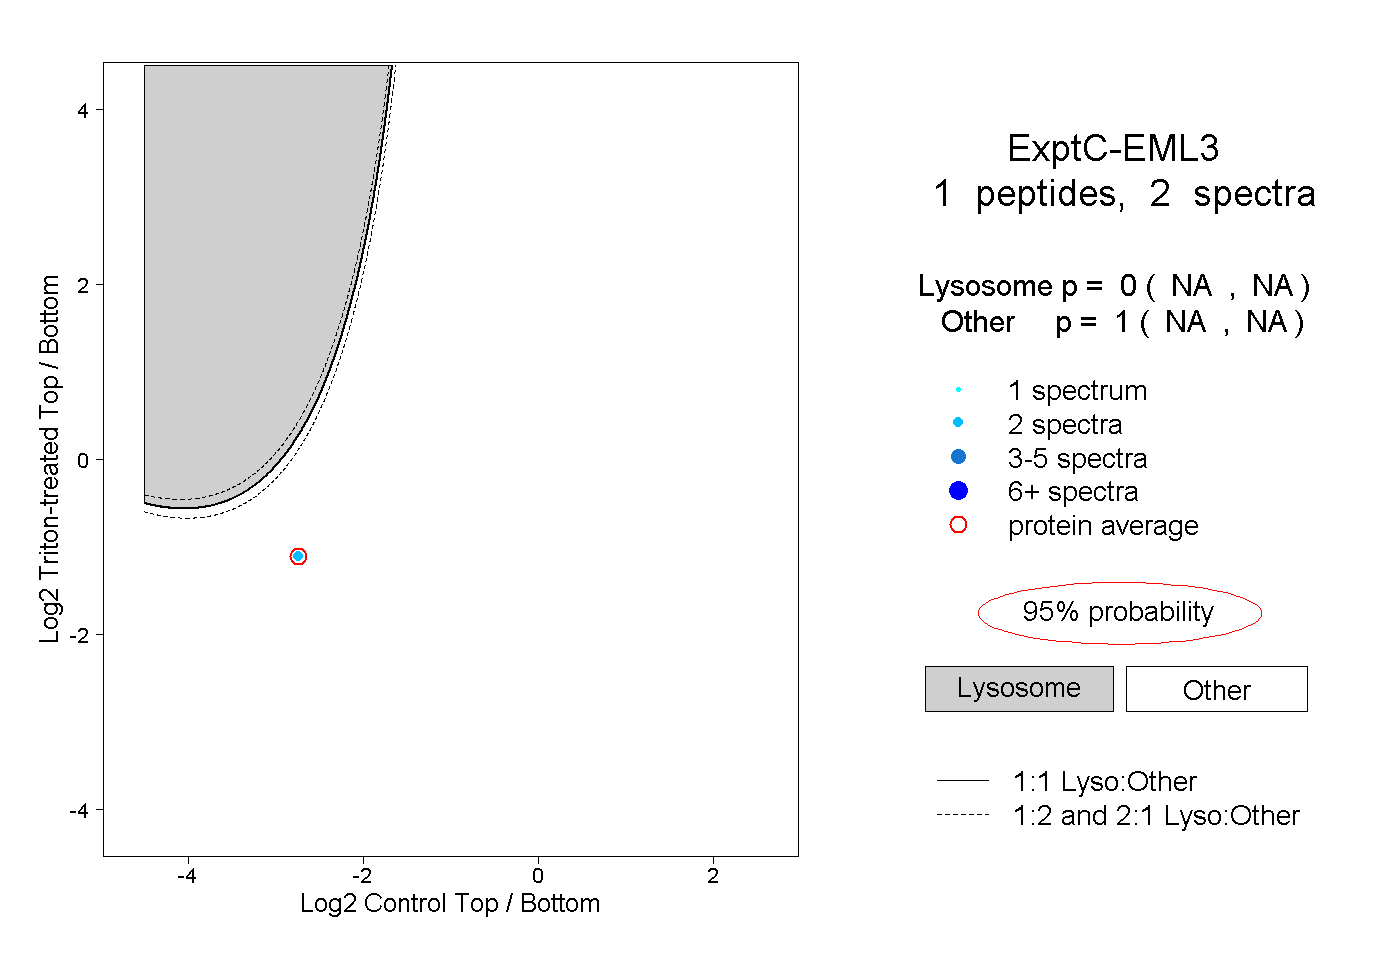
NA | NA
NA | NA