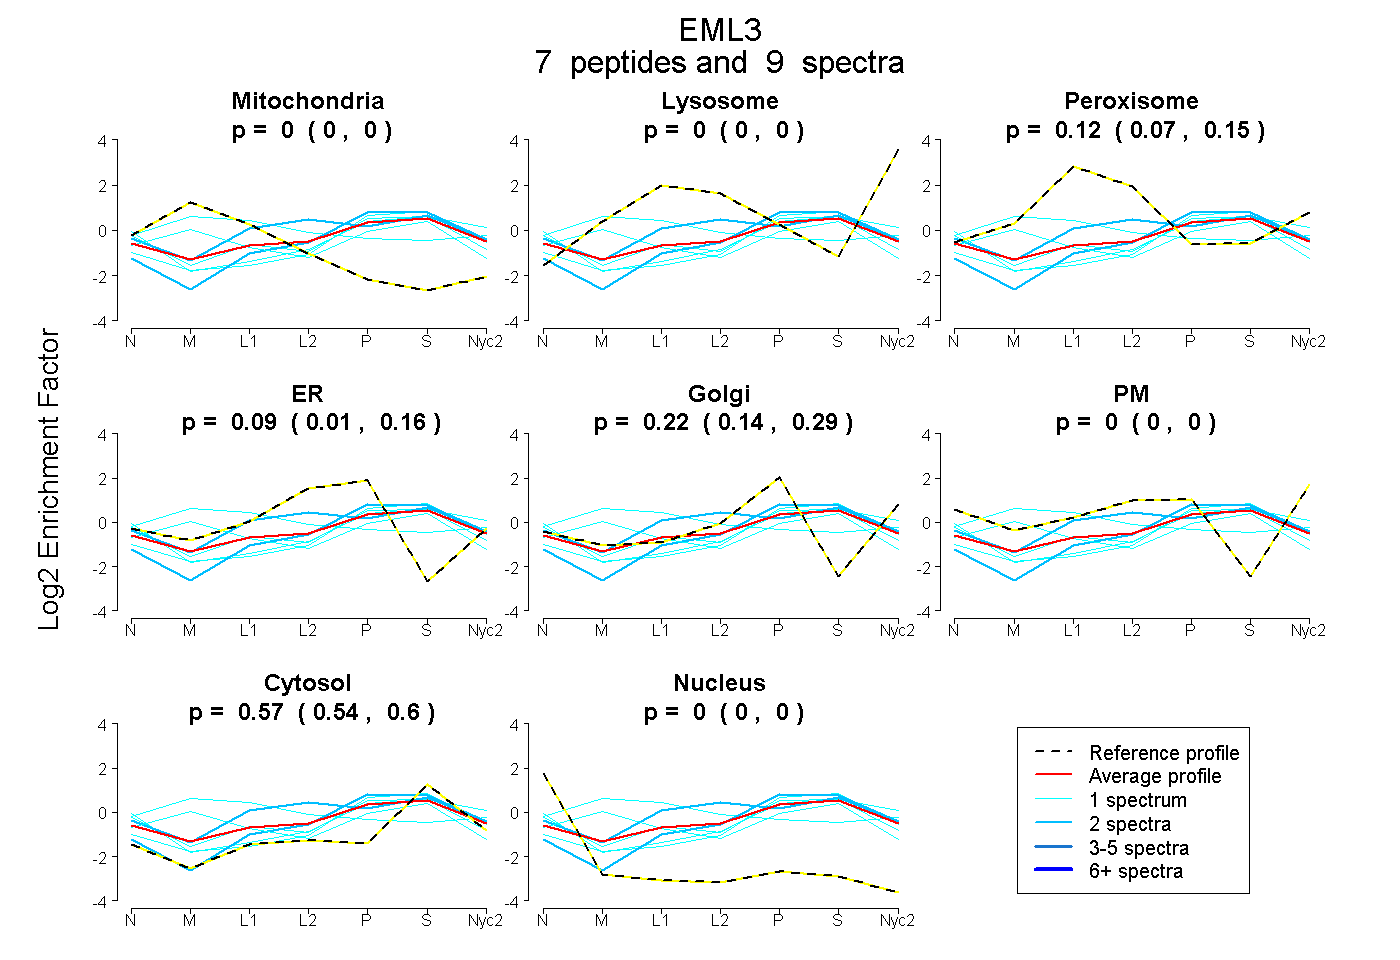
 7
7peptides
spectra
0.000 | 0.000
0.000 | 0.000
0.073 | 0.151
0.010 | 0.159
0.143 | 0.287
0.000 | 0.000
0.541 | 0.596
0.000 | 0.000
| Plot | Mito | Lyso | Perox | ER | Golgi | PM | Cytosol | Nucleus | |||||
| Expt A |
7 peptides |
9 spectra |
|
0.000 0.000 | 0.000 |
0.000 0.000 | 0.000 |
0.115 0.073 | 0.151 |
0.094 0.010 | 0.159 |
0.220 0.143 | 0.287 |
0.000 0.000 | 0.000 |
0.571 0.541 | 0.596 |
0.000 0.000 | 0.000 |
| 1 spectrum, WLVLDTETR | 0.287 | 0.000 | 0.043 | 0.000 | 0.183 | 0.000 | 0.487 | 0.000 | ||
| 1 spectrum, LQEIGLGAFER | 0.000 | 0.000 | 0.000 | 0.000 | 0.328 | 0.000 | 0.672 | 0.000 | ||
| 1 spectrum, GRPITMYIPSGIR | 0.000 | 0.000 | 0.053 | 0.000 | 0.259 | 0.122 | 0.566 | 0.000 | ||
| 1 spectrum, LHGPTTTLQGSGISAPTR | 0.287 | 0.010 | 0.327 | 0.000 | 0.139 | 0.046 | 0.190 | 0.000 | ||
| 2 spectra, VHLFQYPCAR | 0.000 | 0.000 | 0.278 | 0.226 | 0.000 | 0.000 | 0.496 | 0.000 | ||
| 2 spectra, VQEEEMELVK | 0.000 | 0.000 | 0.000 | 0.087 | 0.245 | 0.000 | 0.668 | 0.000 | ||
| 1 spectrum, DGTVLSGGGR | 0.000 | 0.000 | 0.000 | 0.102 | 0.238 | 0.000 | 0.620 | 0.041 |
| Plot | Mito | Lyso or Perox | ER | Golgi | PM | Cytosol | Nucleus | ||||||
| Expt B |
2 peptides |
2 spectra |
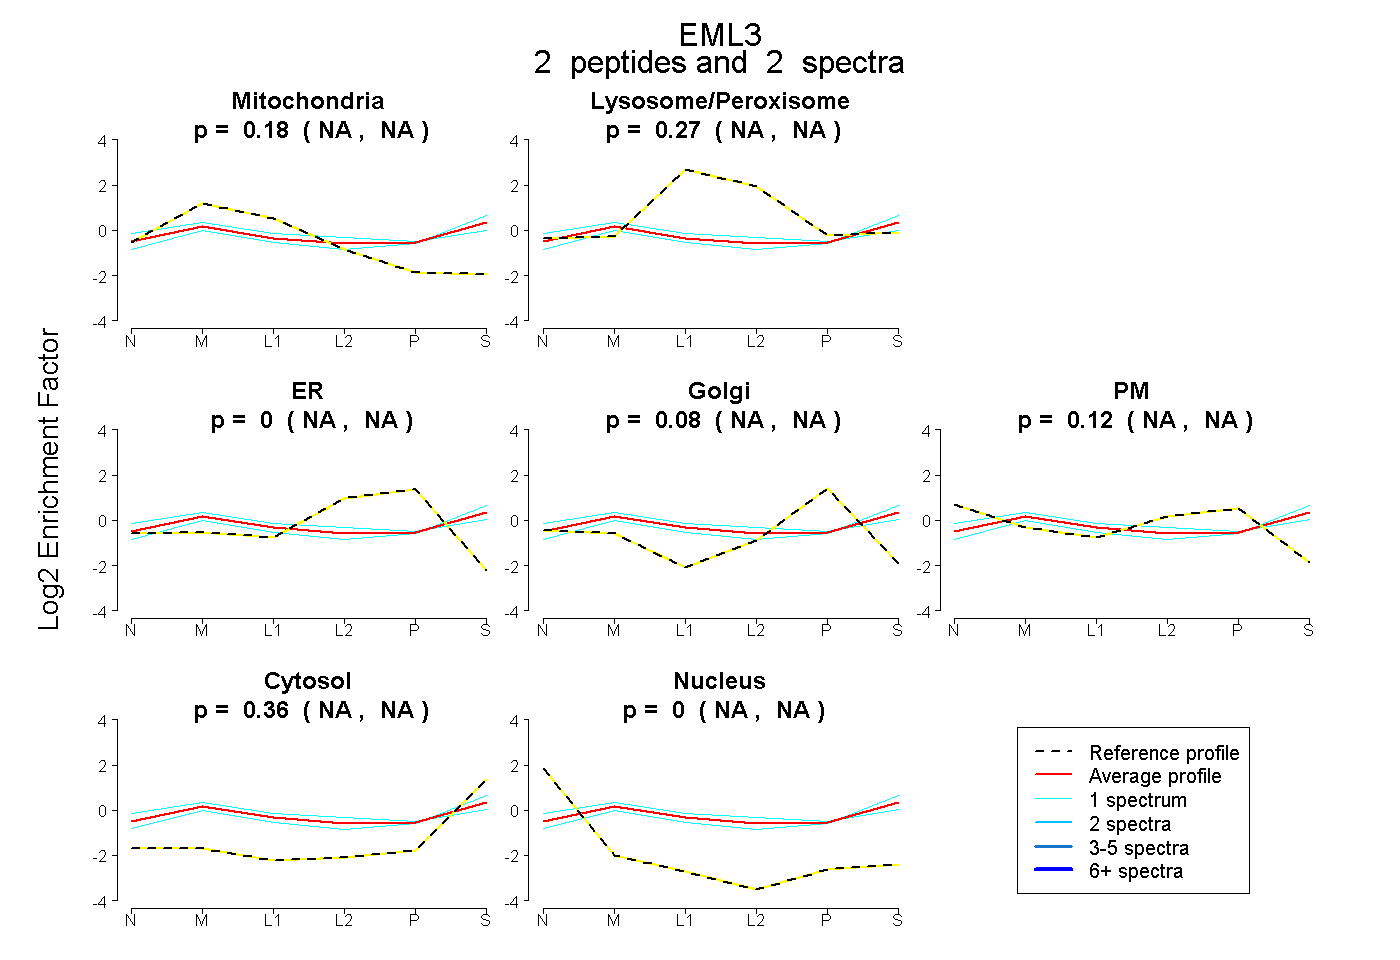 |
0.176 NA | NA |
0.267 NA | NA |
0.000 NA | NA |
0.083 NA | NA |
0.115 NA | NA |
0.360 NA | NA |
0.000 NA | NA |
|||
| Plot | Lyso | Other | |||||||||||
| Expt C |
1 peptide |
2 spectra |
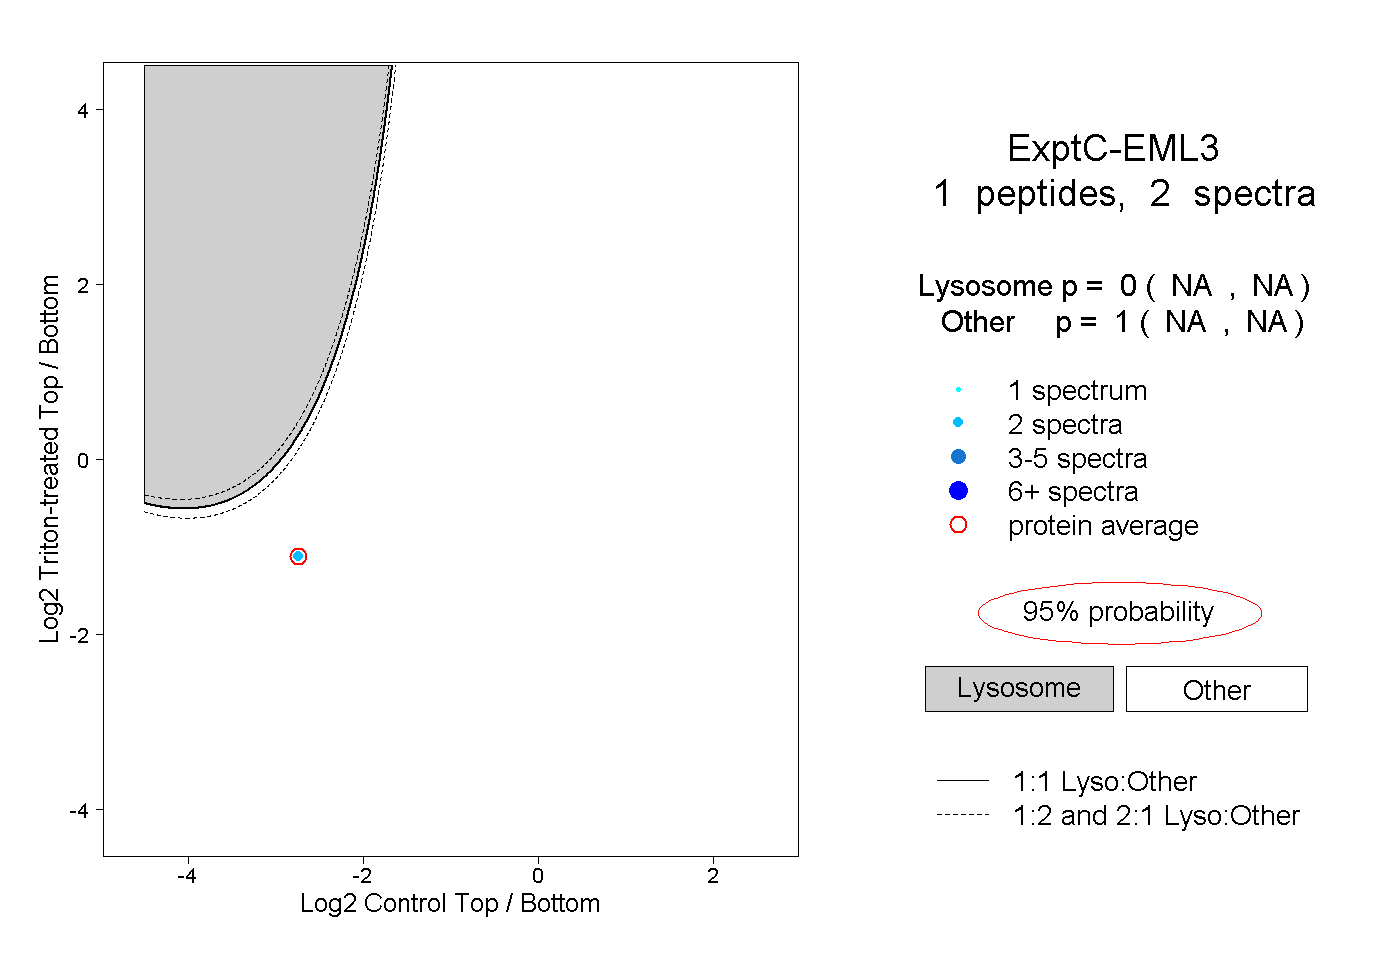 |
0.000 NA | NA |
1.000 NA | NA |