 8
8peptides
spectra
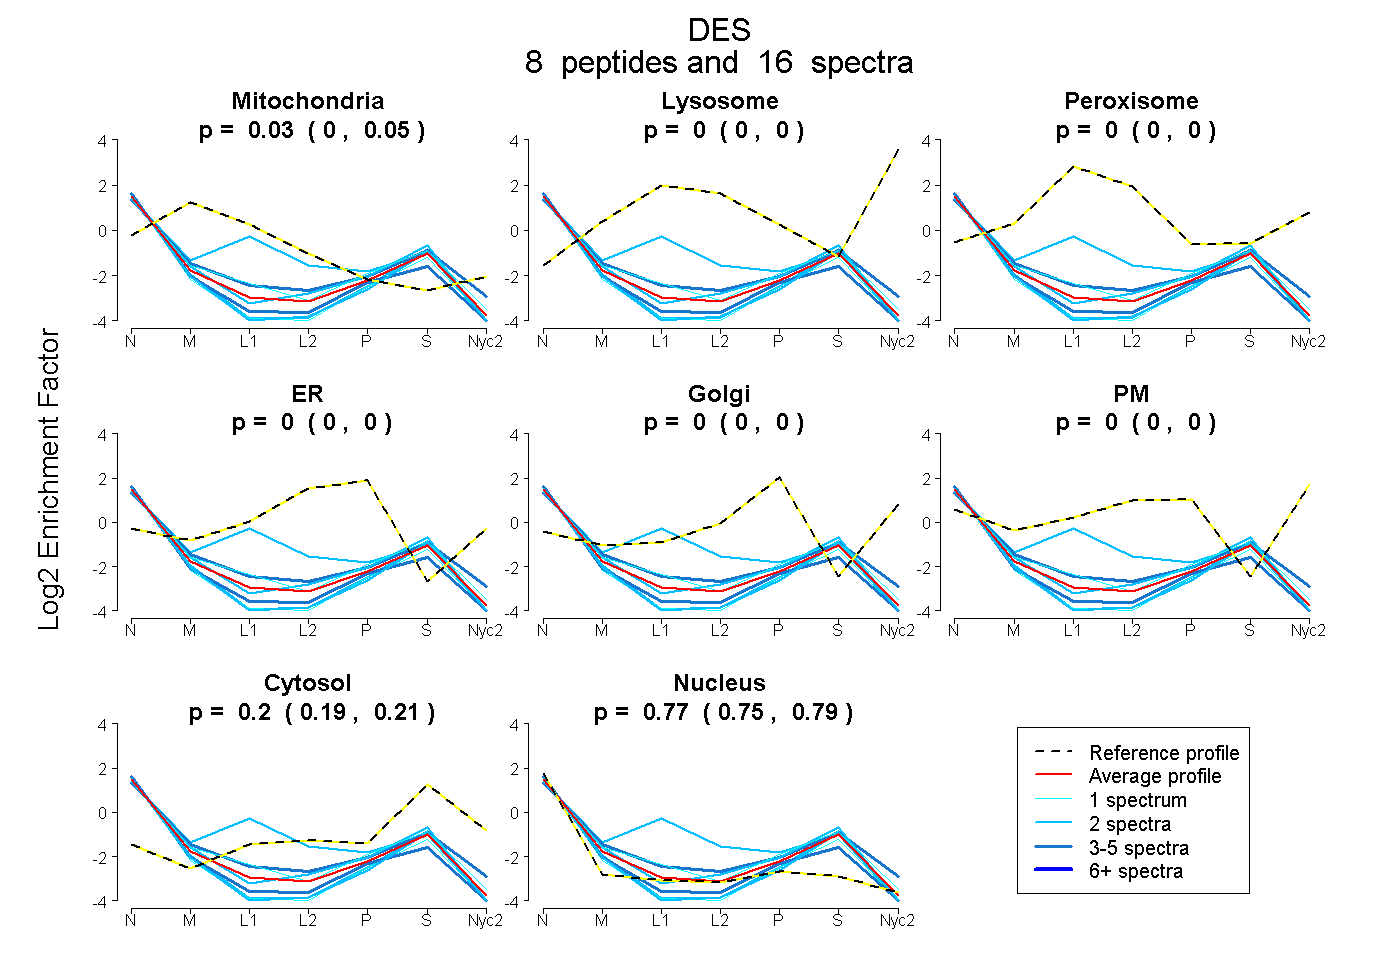
0.004 | 0.046
0.000 | 0.000
0.000 | 0.000
0.000 | 0.000
0.000 | 0.000
0.000 | 0.000
0.191 | 0.213
0.748 | 0.787
3peptides
spectra
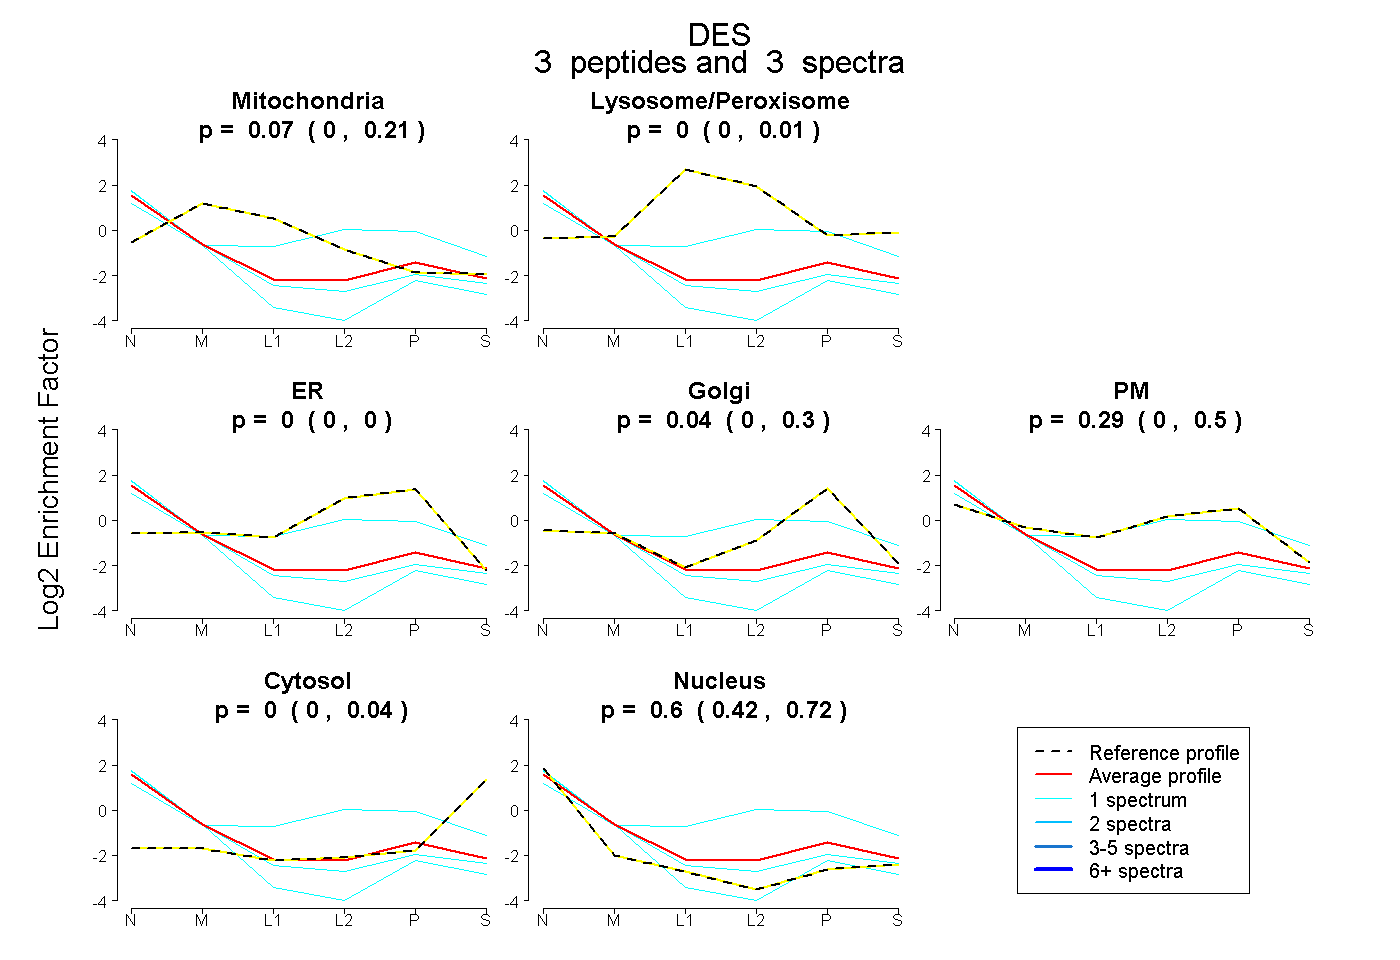
0.000 | 0.214
0.000 | 0.007
0.000 | 0.000
0.000 | 0.298
0.000 | 0.497
0.000 | 0.041
0.423 | 0.718