DES
[ENSRNOP00000026860]
Main page
| | | Plot |
Mito |
Lyso |
|
Perox |
ER |
Golgi |
PM |
Cytosol |
Nucleus |
|
| Expt A |
 8
8
peptides |
16
spectra |
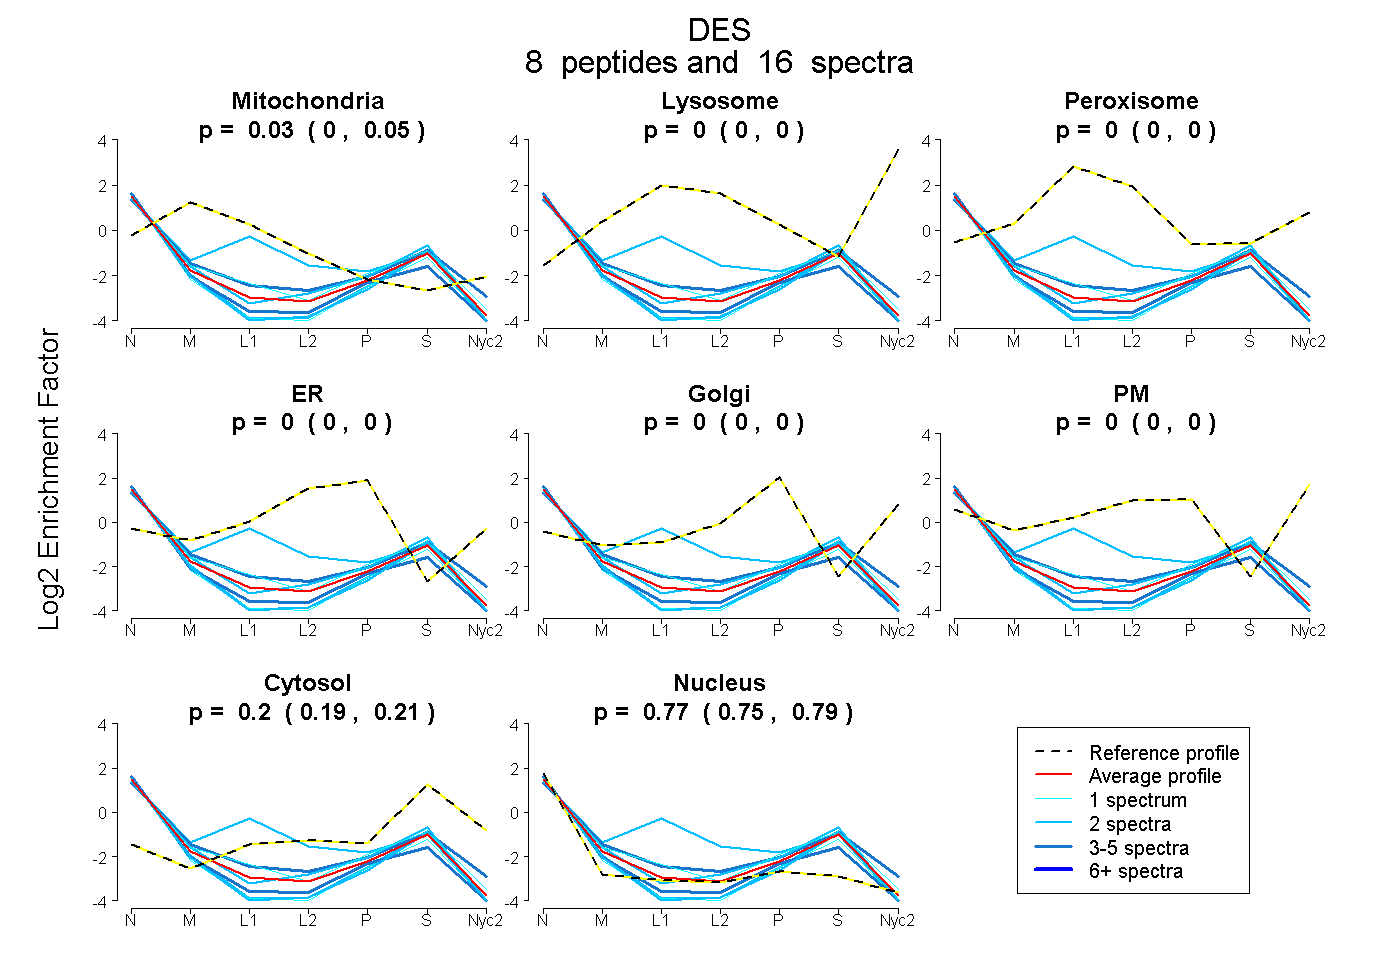 |
0.028
0.004 | 0.046 |
0.000
0.000 | 0.000 |
|
0.000
0.000 | 0.000 |
0.000
0.000 | 0.000 |
0.000
0.000 | 0.000 |
0.000
0.000 | 0.000 |
0.203
0.191 | 0.213 |
0.769
0.748 | 0.787 |
|
| | | Plot |
Mito |
|
Lyso or Perox |
|
ER |
Golgi |
PM |
Cytosol |
Nucleus |
|
| Expt B |
3
peptides |
3
spectra |
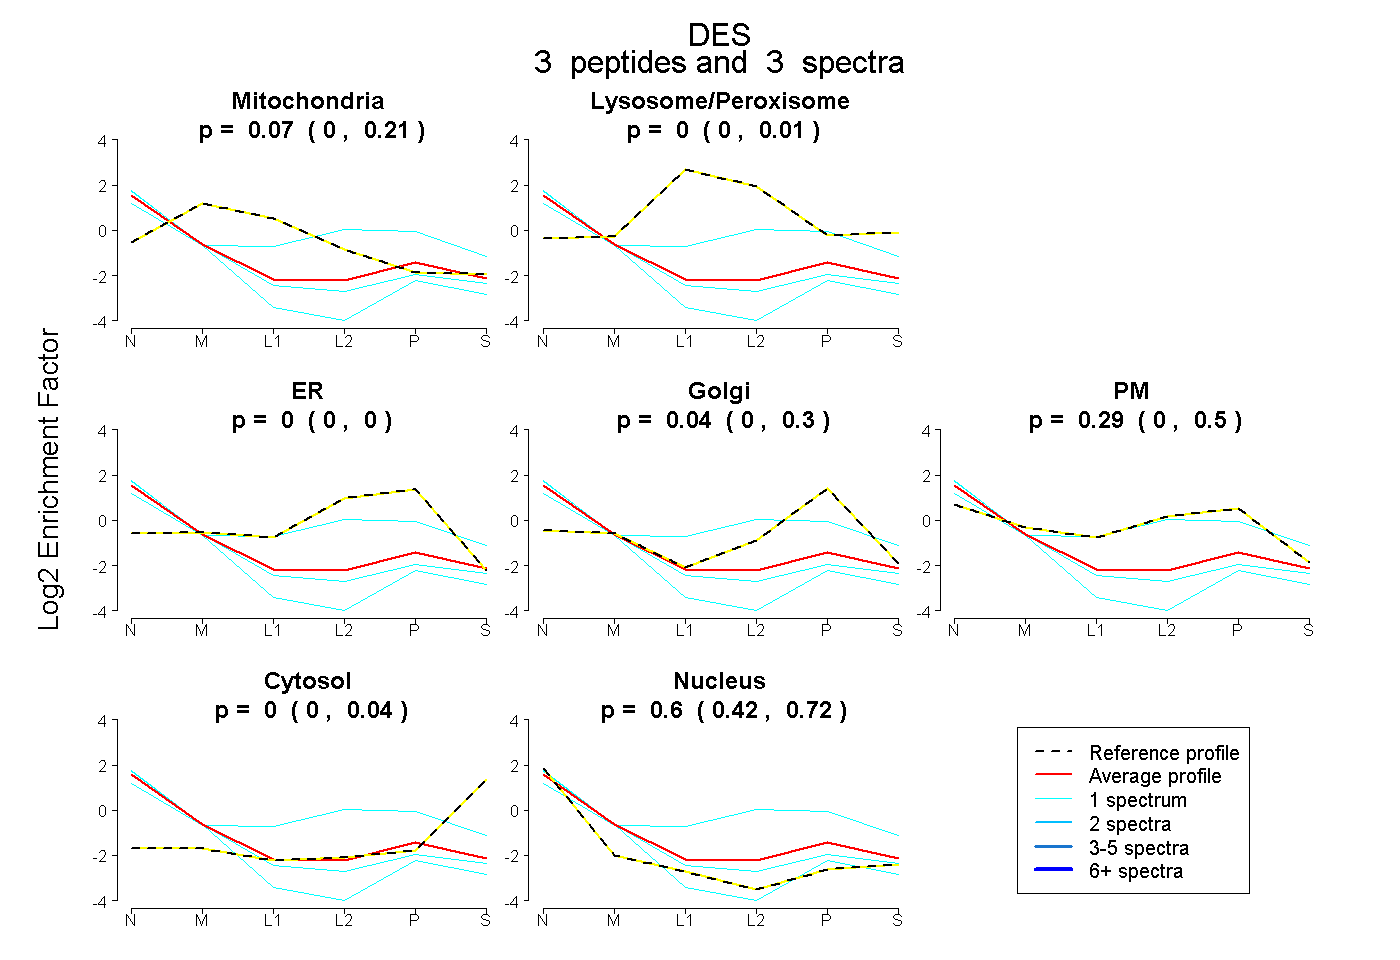 |
0.072
0.000 | 0.214 |
|
0.000
0.000 | 0.007 |
|
0.000
0.000 | 0.000 |
0.042
0.000 | 0.298 |
0.288
0.000 | 0.497 |
0.000
0.000 | 0.041 |
0.599
0.423 | 0.718 |
|
| 1 spectrum, VYQVSR |
0.000 |
|
0.152 |
|
0.000 |
0.000 |
0.676 |
0.028 |
0.144 |
|
| 1 spectrum, QVEVLTNQR |
0.129 |
|
0.000 |
|
0.000 |
0.024 |
0.122 |
0.000 |
0.725 |
|
| 1 spectrum, ADVDAATLAR |
0.000 |
|
0.000 |
|
0.000 |
0.050 |
0.000 |
0.000 |
0.950 |
|