 9
9peptides
spectra
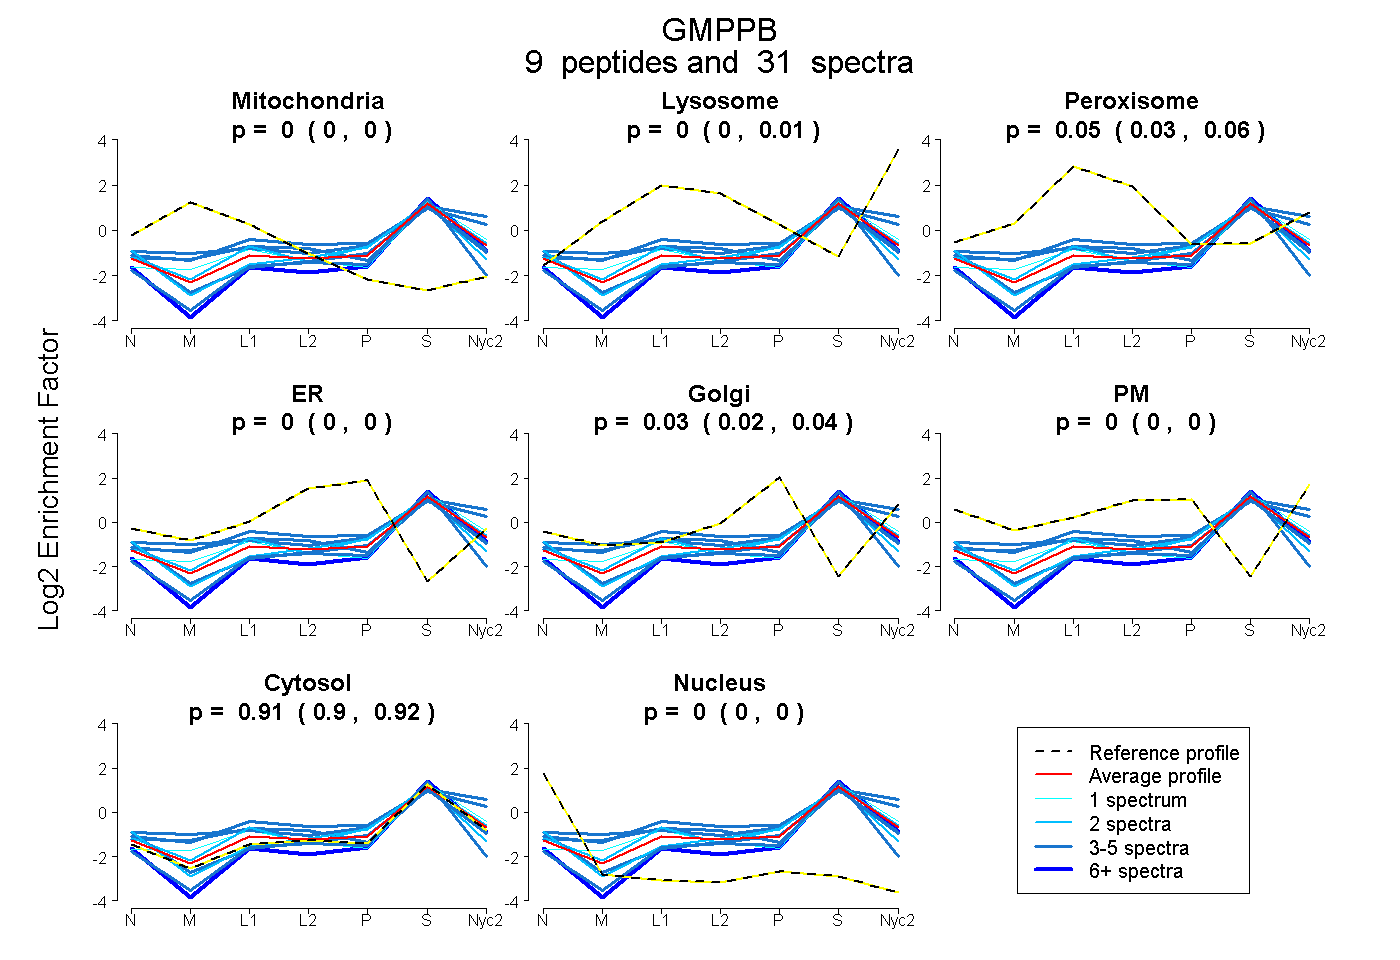
0.000 | 0.004
0.000 | 0.014
0.032 | 0.061
0.000 | 0.000
0.022 | 0.041
0.000 | 0.000
0.902 | 0.924
0.000 | 0.000
1peptide
spectrum
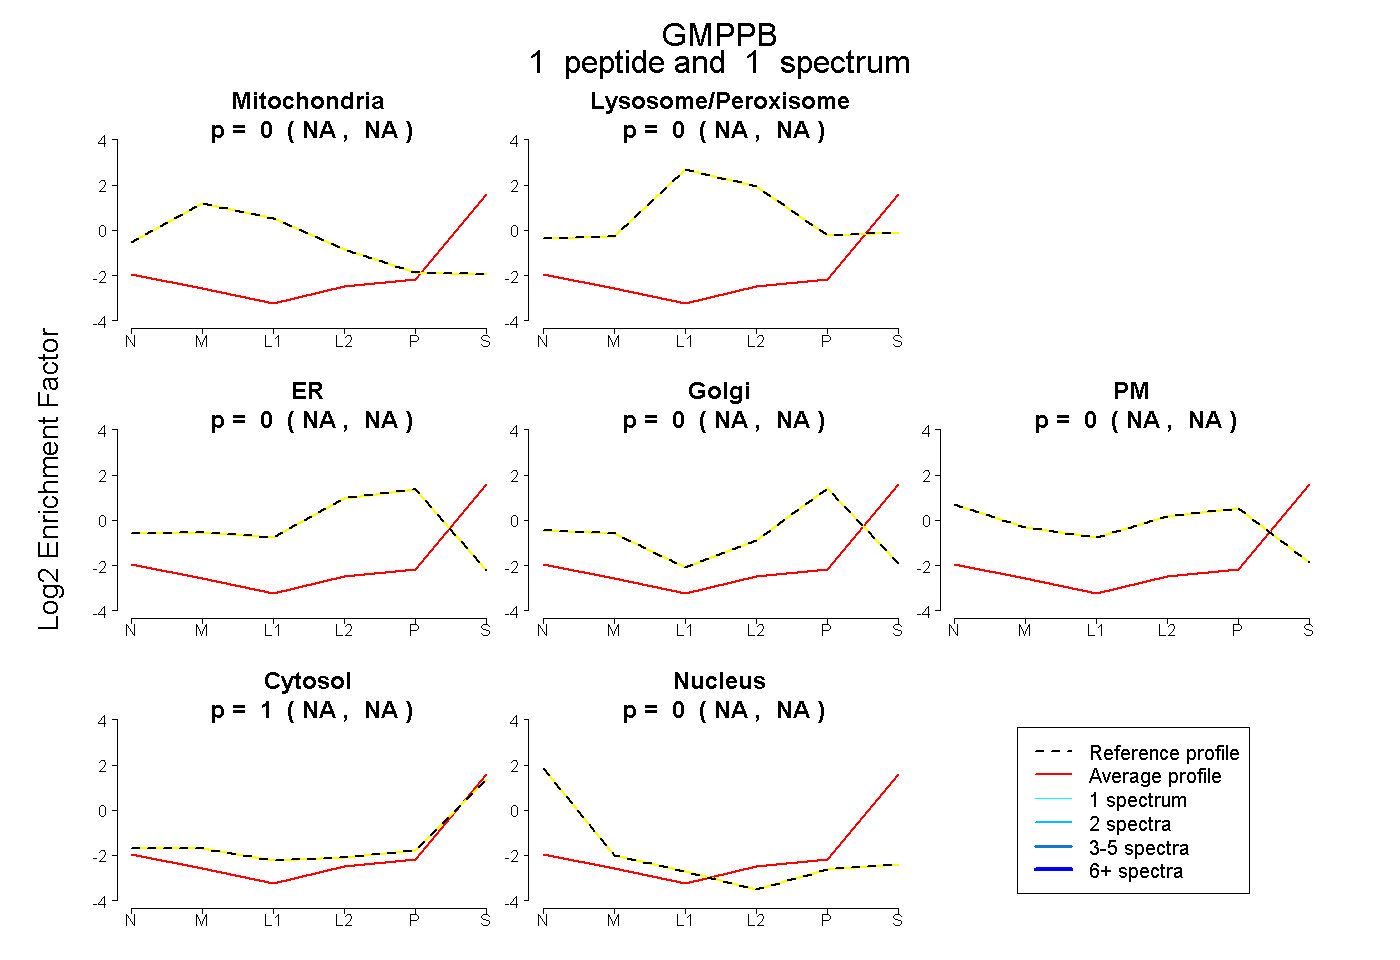
NA | NA
NA | NA
NA | NA
NA | NA
NA | NA
NA | NA
NA | NA
8peptides
spectra
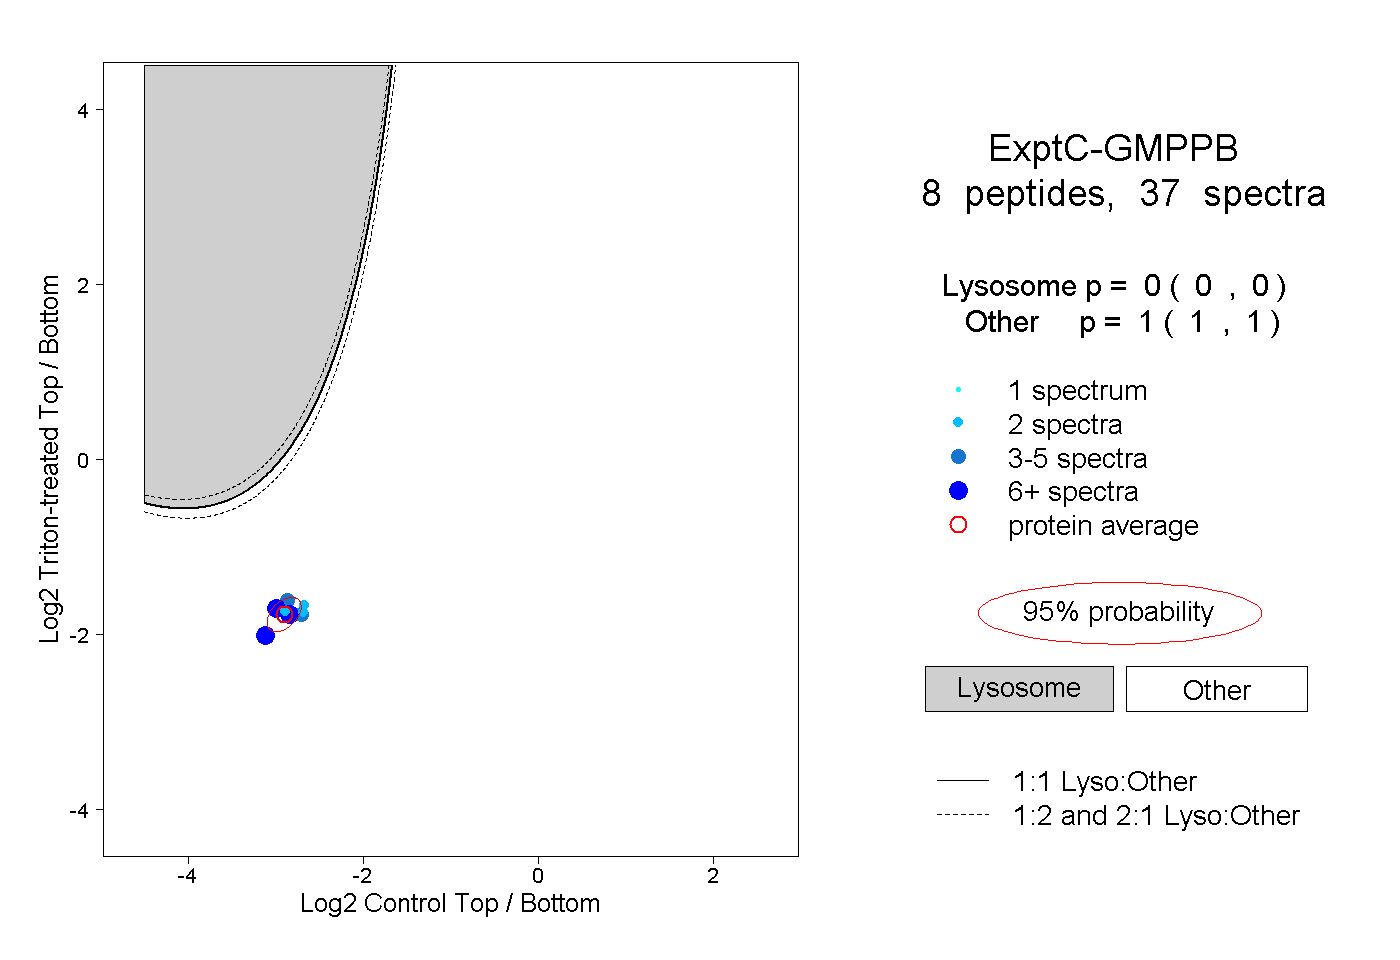
0.000 | 0.000
1.000 | 1.000
1peptide
spectra
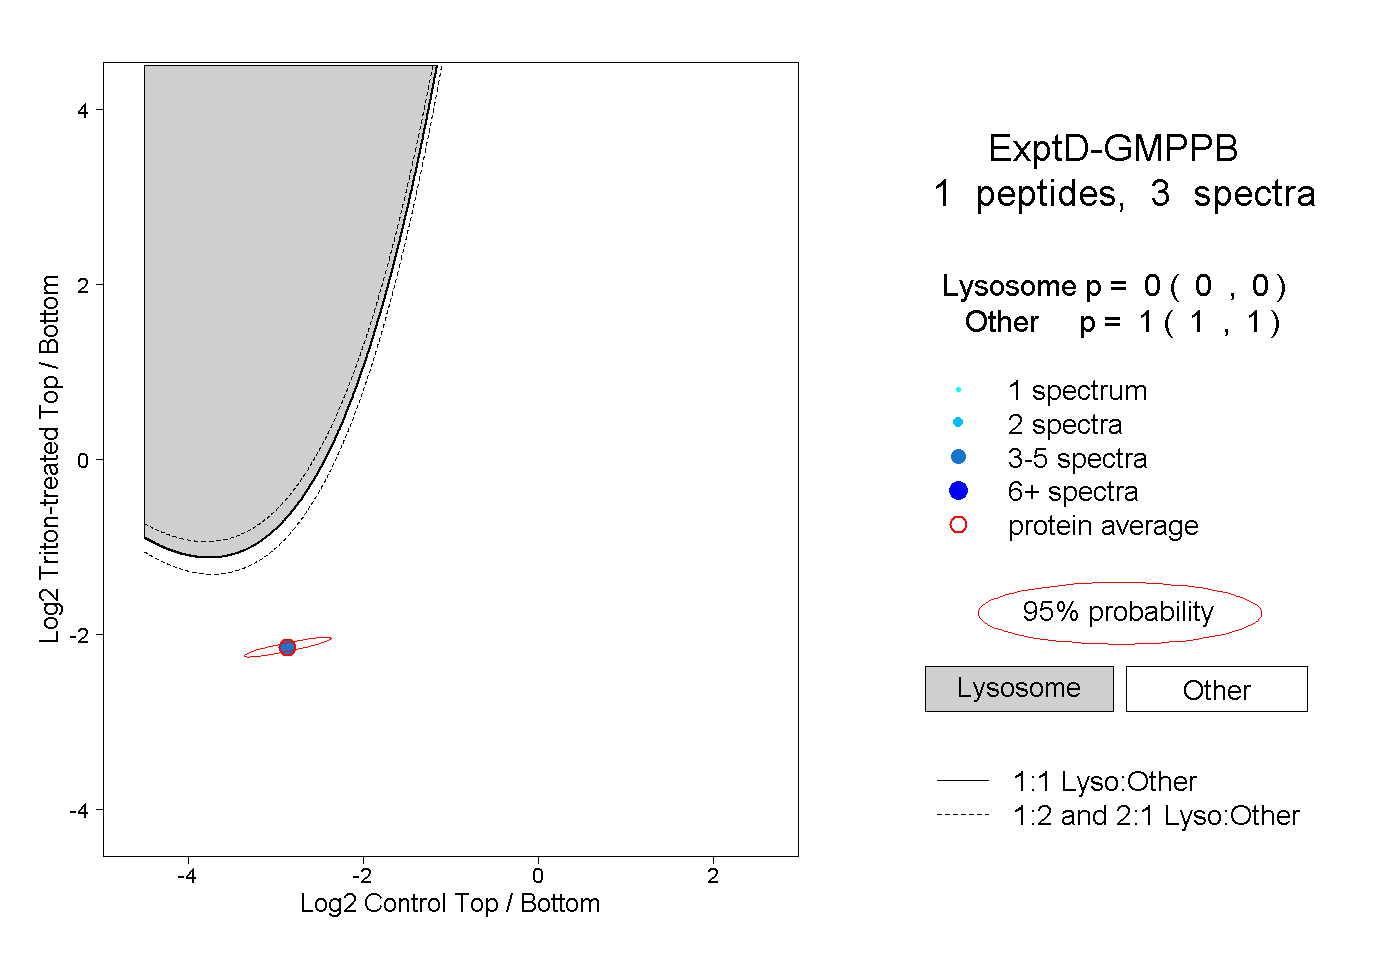
0.000 | 0.000
1.000 | 1.000