 9
9peptides
spectra
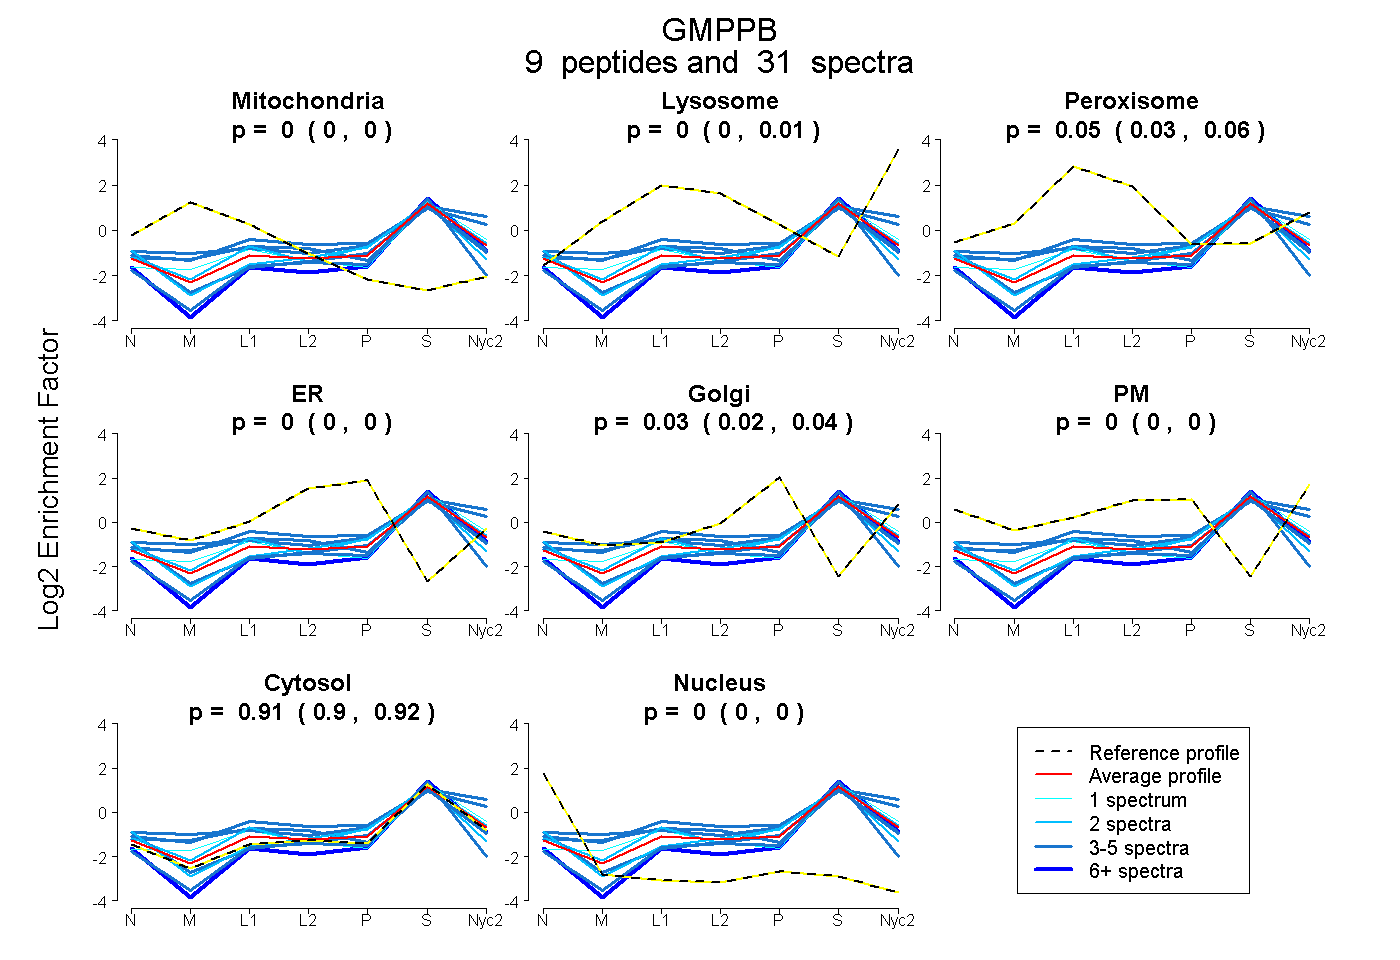
0.000 | 0.004
0.000 | 0.014
0.032 | 0.061
0.000 | 0.000
0.022 | 0.041
0.000 | 0.000
0.902 | 0.924
0.000 | 0.000
| Plot | Mito | Lyso | Perox | ER | Golgi | PM | Cytosol | Nucleus | |||||
| Expt A |
9 peptides |
31 spectra |
|
0.000 0.000 | 0.004 |
0.000 0.000 | 0.014 |
0.052 0.032 | 0.061 |
0.000 0.000 | 0.000 |
0.034 0.022 | 0.041 |
0.000 0.000 | 0.000 |
0.914 0.902 | 0.924 |
0.000 0.000 | 0.000 |
| 8 spectra, ALILVGGYGTR | 0.000 | 0.000 | 0.000 | 0.000 | 0.000 | 0.000 | 0.978 | 0.022 | ||
| 3 spectra, SIGESVPEPR | 0.000 | 0.000 | 0.000 | 0.000 | 0.041 | 0.000 | 0.896 | 0.063 | ||
| 1 spectrum, HHGQEGSILVTK | 0.046 | 0.081 | 0.000 | 0.000 | 0.000 | 0.000 | 0.873 | 0.000 | ||
| 2 spectra, LYSGPGVVGNVLVDPSAR | 0.034 | 0.000 | 0.034 | 0.050 | 0.000 | 0.000 | 0.881 | 0.000 | ||
| 2 spectra, VEEPSK | 0.000 | 0.000 | 0.000 | 0.000 | 0.085 | 0.000 | 0.911 | 0.004 | ||
| 4 spectra, EIFPVMAK | 0.010 | 0.250 | 0.000 | 0.000 | 0.000 | 0.000 | 0.740 | 0.000 | ||
| 4 spectra, SHSWLESCIVGWR | 0.029 | 0.000 | 0.197 | 0.054 | 0.000 | 0.000 | 0.720 | 0.000 | ||
| 4 spectra, ISMSHEEEPLGTAGPLALAR | 0.047 | 0.186 | 0.000 | 0.000 | 0.001 | 0.059 | 0.707 | 0.000 | ||
| 3 spectra, YGVVVCEADTGR | 0.000 | 0.000 | 0.000 | 0.000 | 0.000 | 0.000 | 0.942 | 0.058 |
| Plot | Mito | Lyso or Perox | ER | Golgi | PM | Cytosol | Nucleus | ||||||
| Expt B |
1 peptide |
1 spectrum |
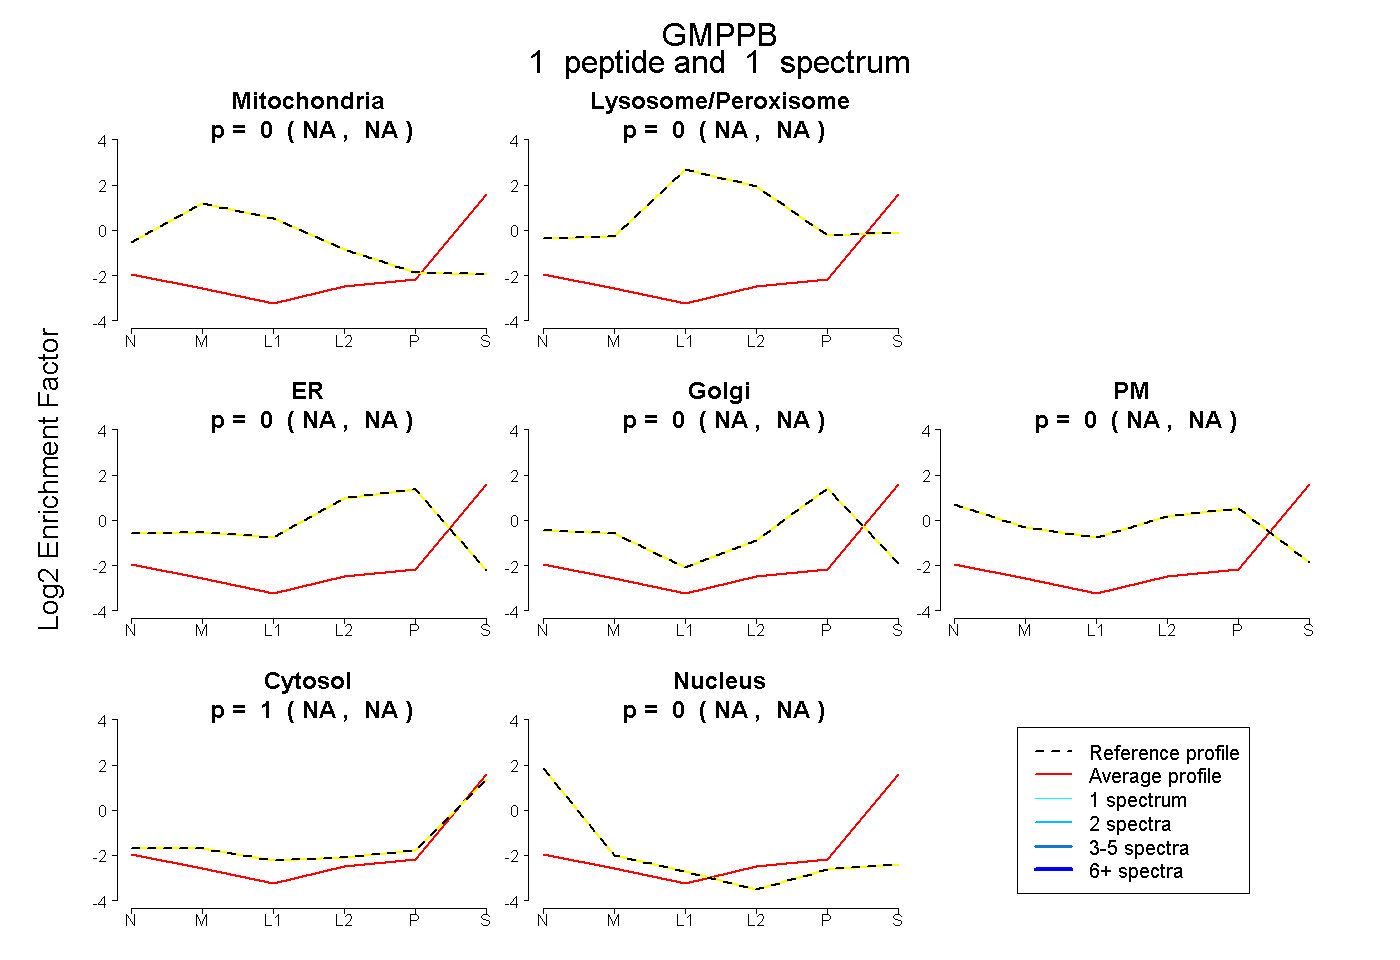 |
0.000 NA | NA |
0.000 NA | NA |
0.000 NA | NA |
0.000 NA | NA |
0.000 NA | NA |
1.000 NA | NA |
0.000 NA | NA |
|||
| Plot | Lyso | Other | |||||||||||
| Expt C |
8 peptides |
37 spectra |
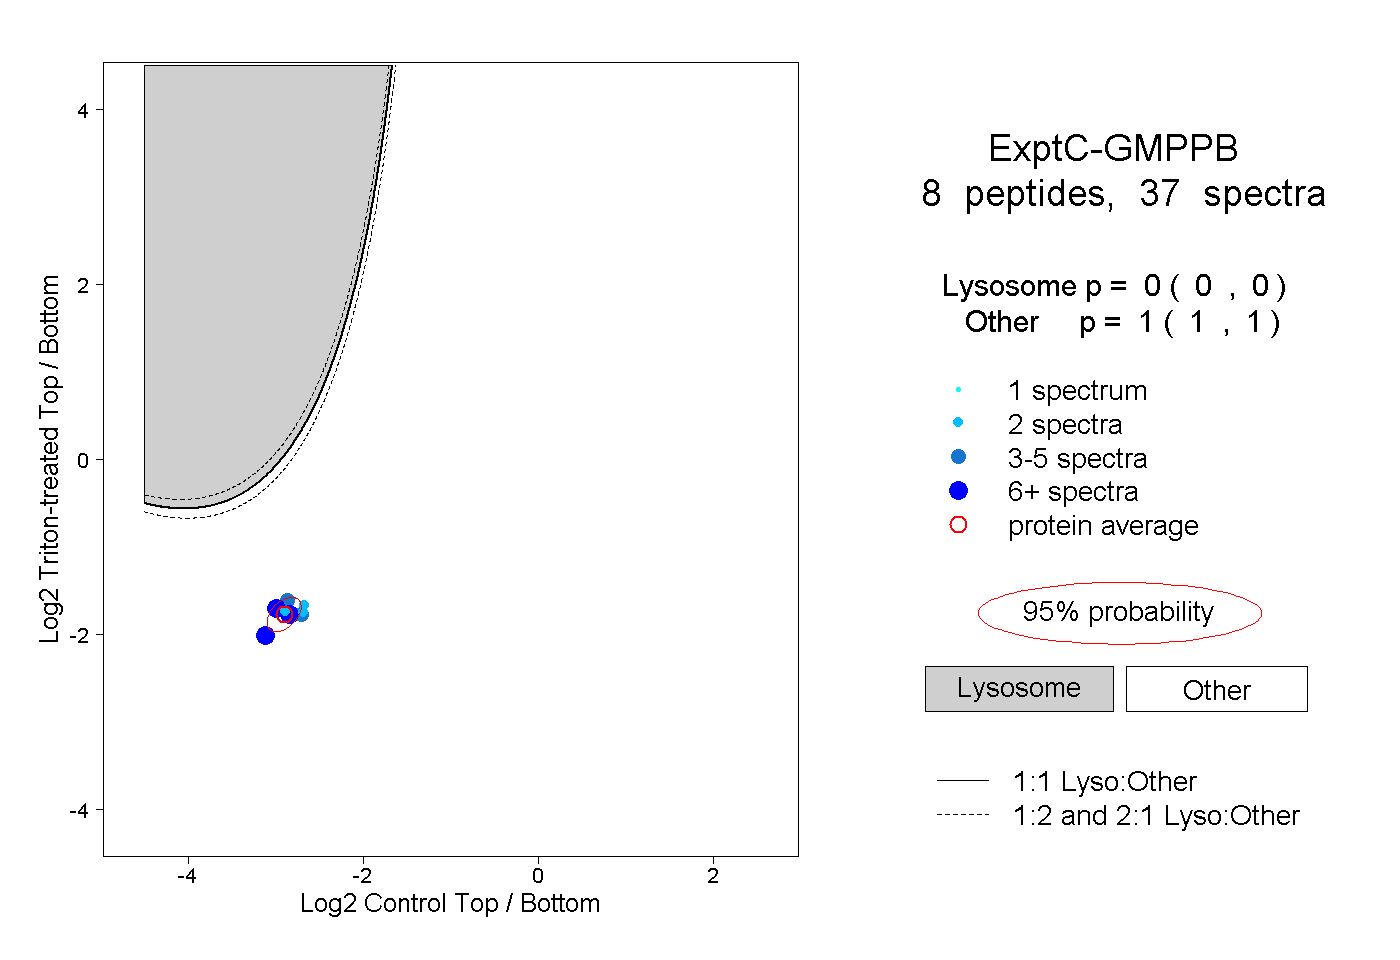 |
0.000 0.000 | 0.000 |
1.000 1.000 | 1.000 |
||||||||
| Plot | Lyso | Other | |||||||||||
| Expt D |
1 peptide |
3 spectra |
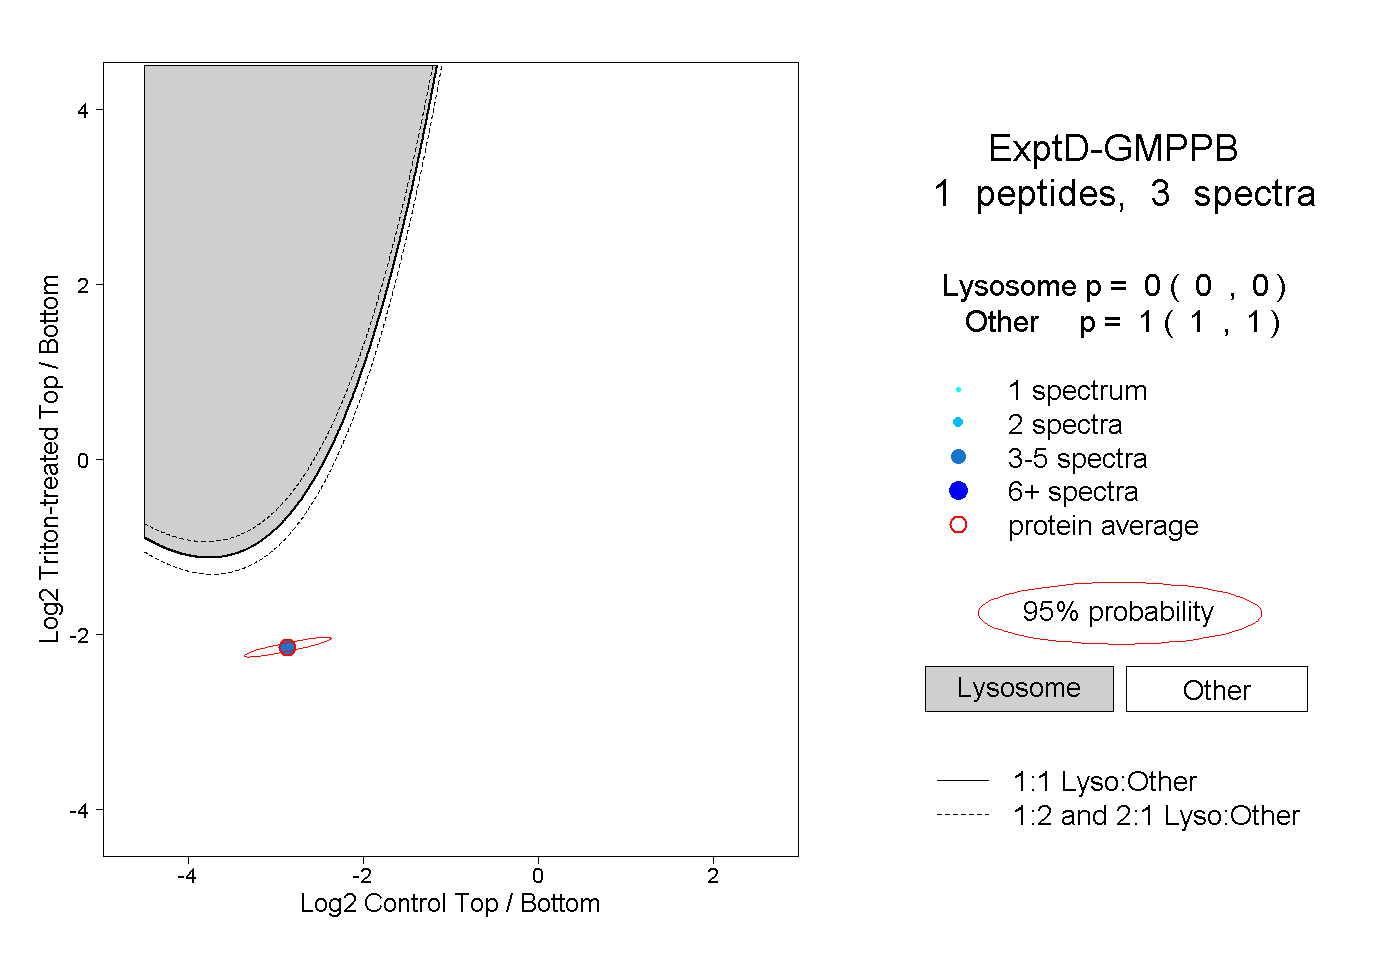 |
0.000 0.000 | 0.000 |
1.000 1.000 | 1.000 |