 13
13peptides
spectra
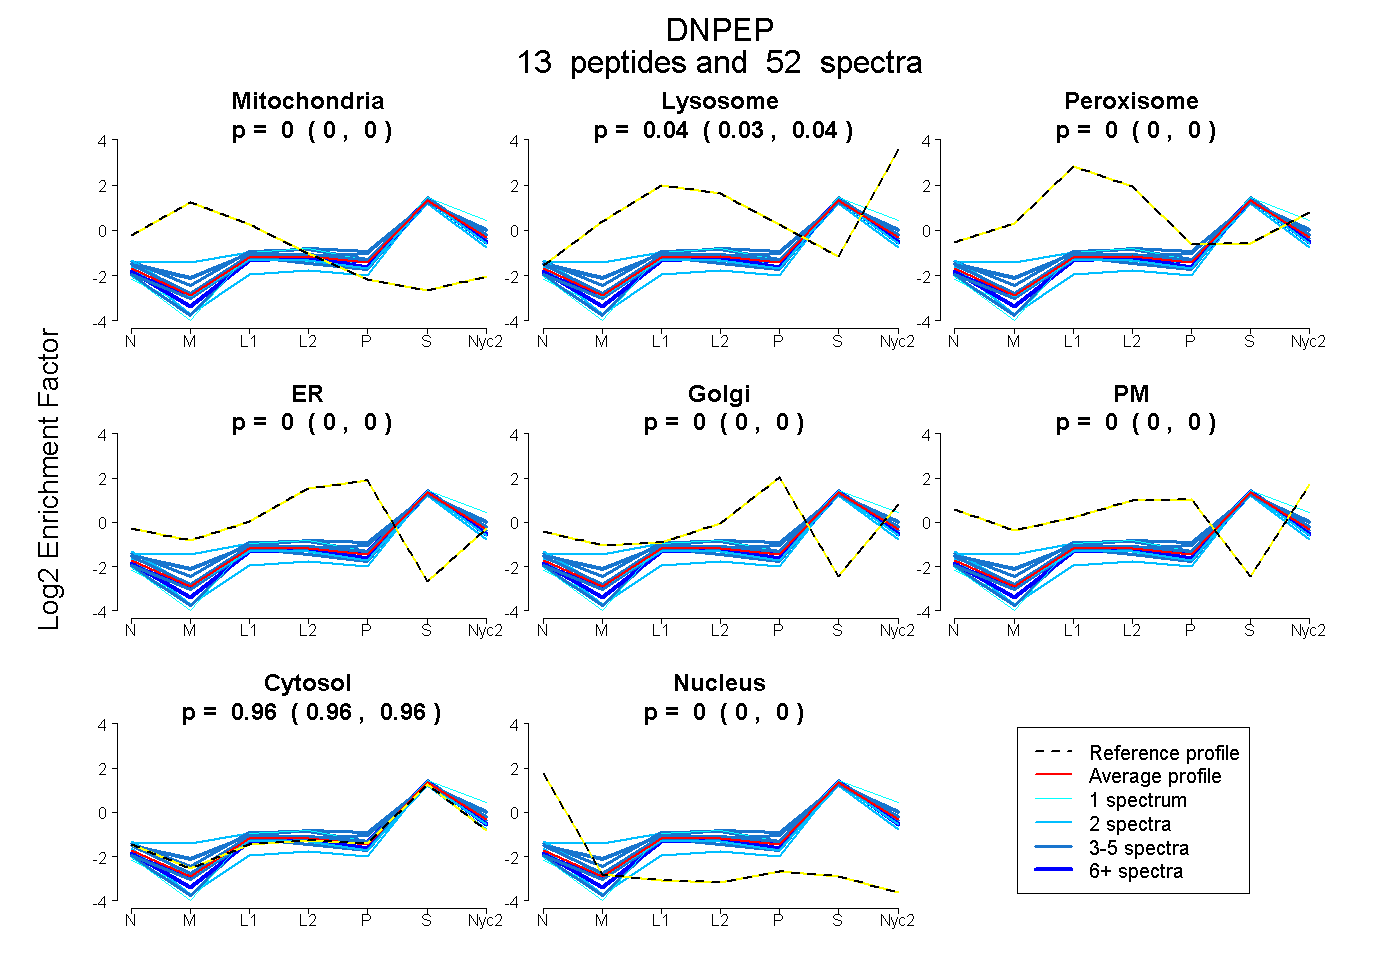
0.000 | 0.000
0.035 | 0.041
0.000 | 0.000
0.000 | 0.000
0.000 | 0.000
0.000 | 0.000
0.958 | 0.965
0.000 | 0.000
8peptides
spectra
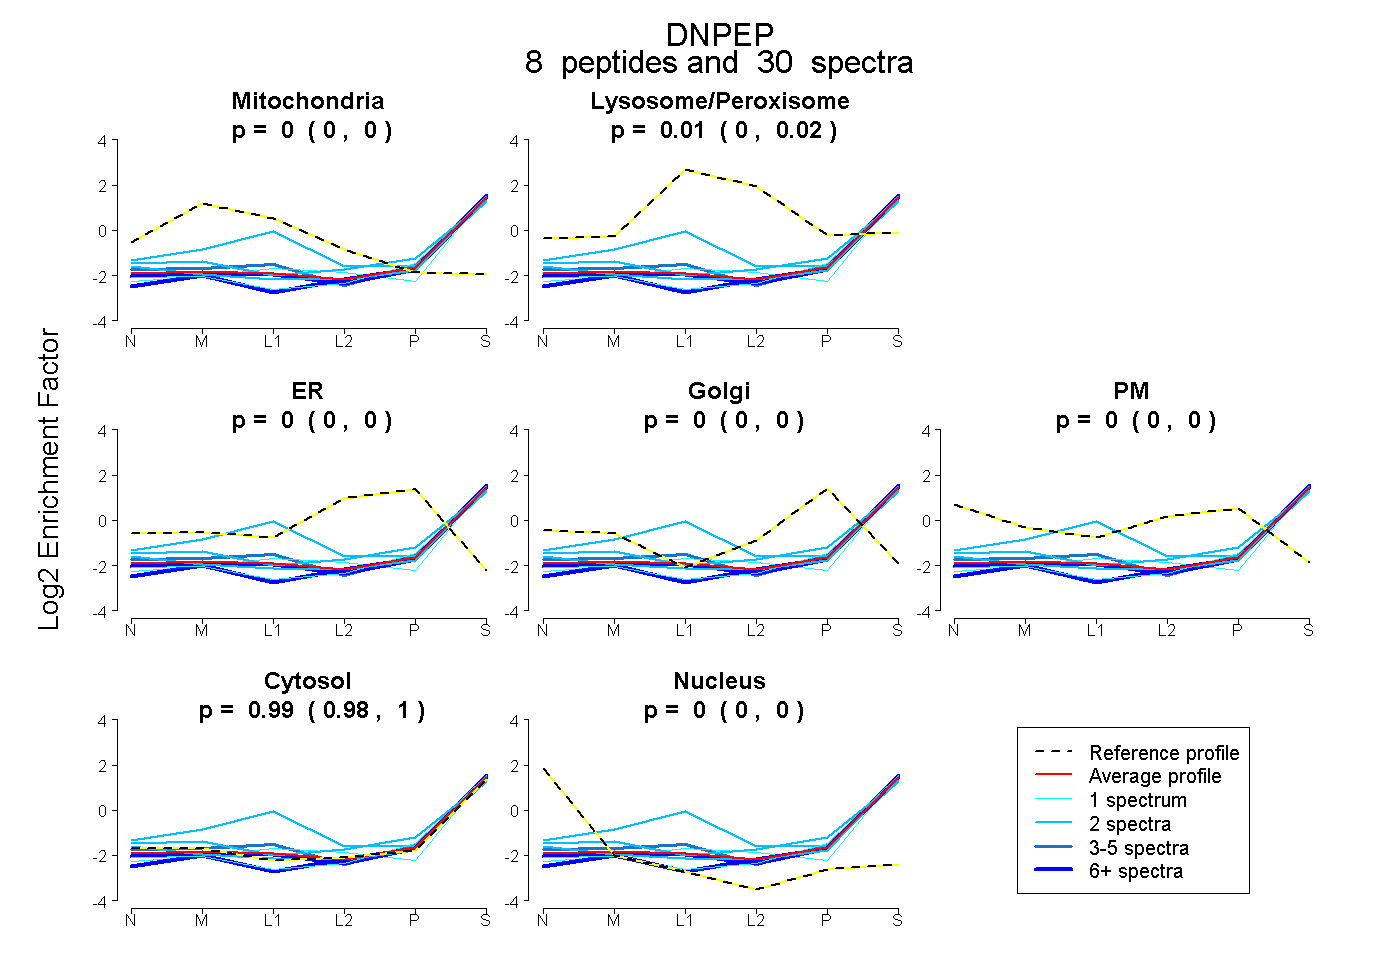
0.000 | 0.000
0.003 | 0.023
0.000 | 0.000
0.000 | 0.000
0.000 | 0.000
0.975 | 0.995
0.000 | 0.000
14peptides
spectra
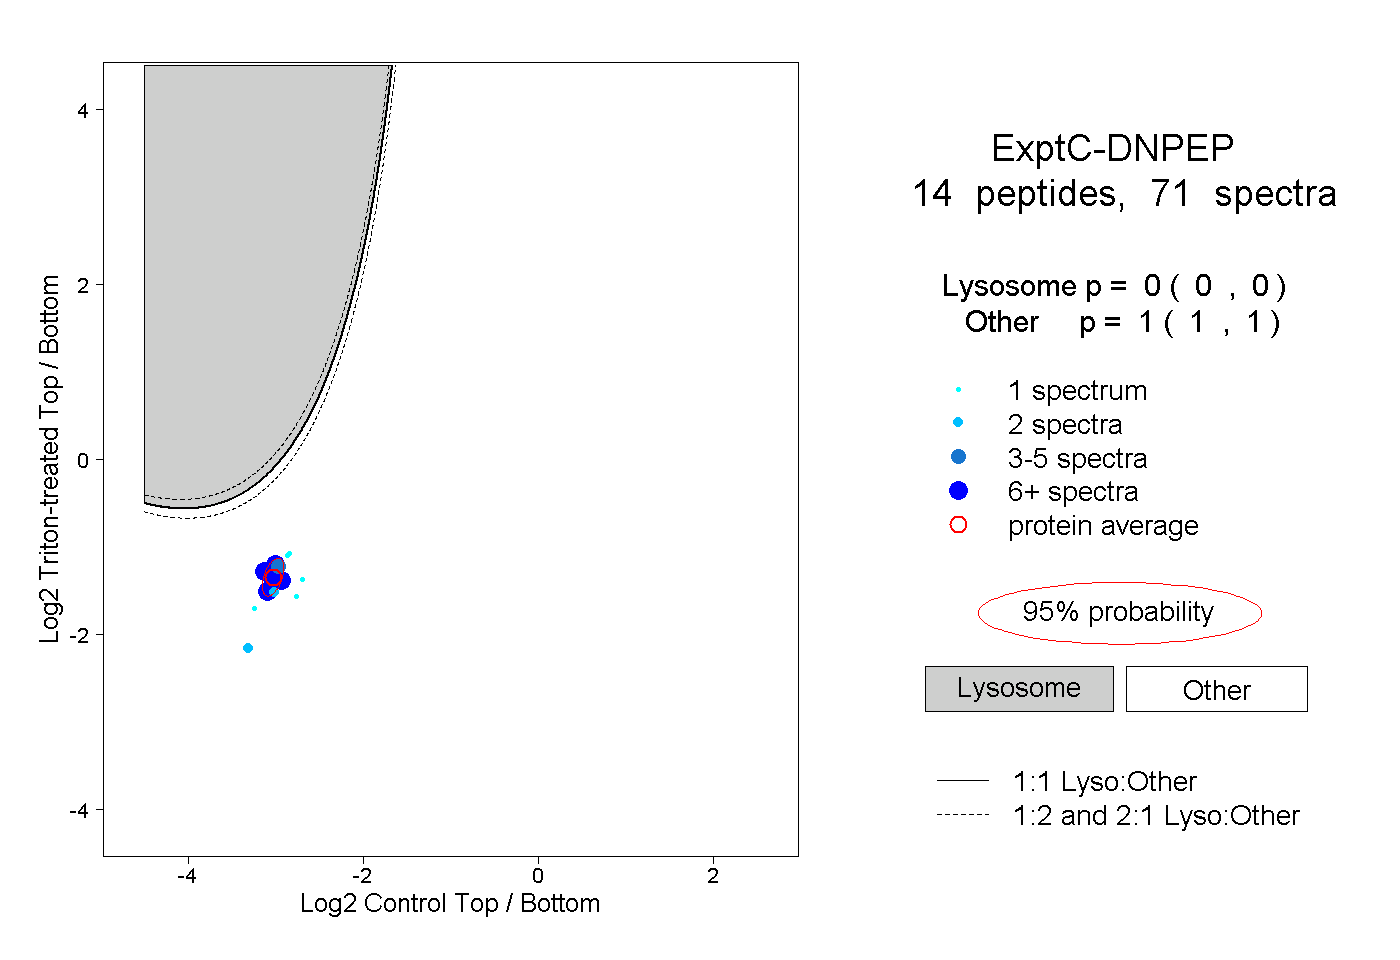
0.000 | 0.000
1.000 | 1.000
6peptides
spectra
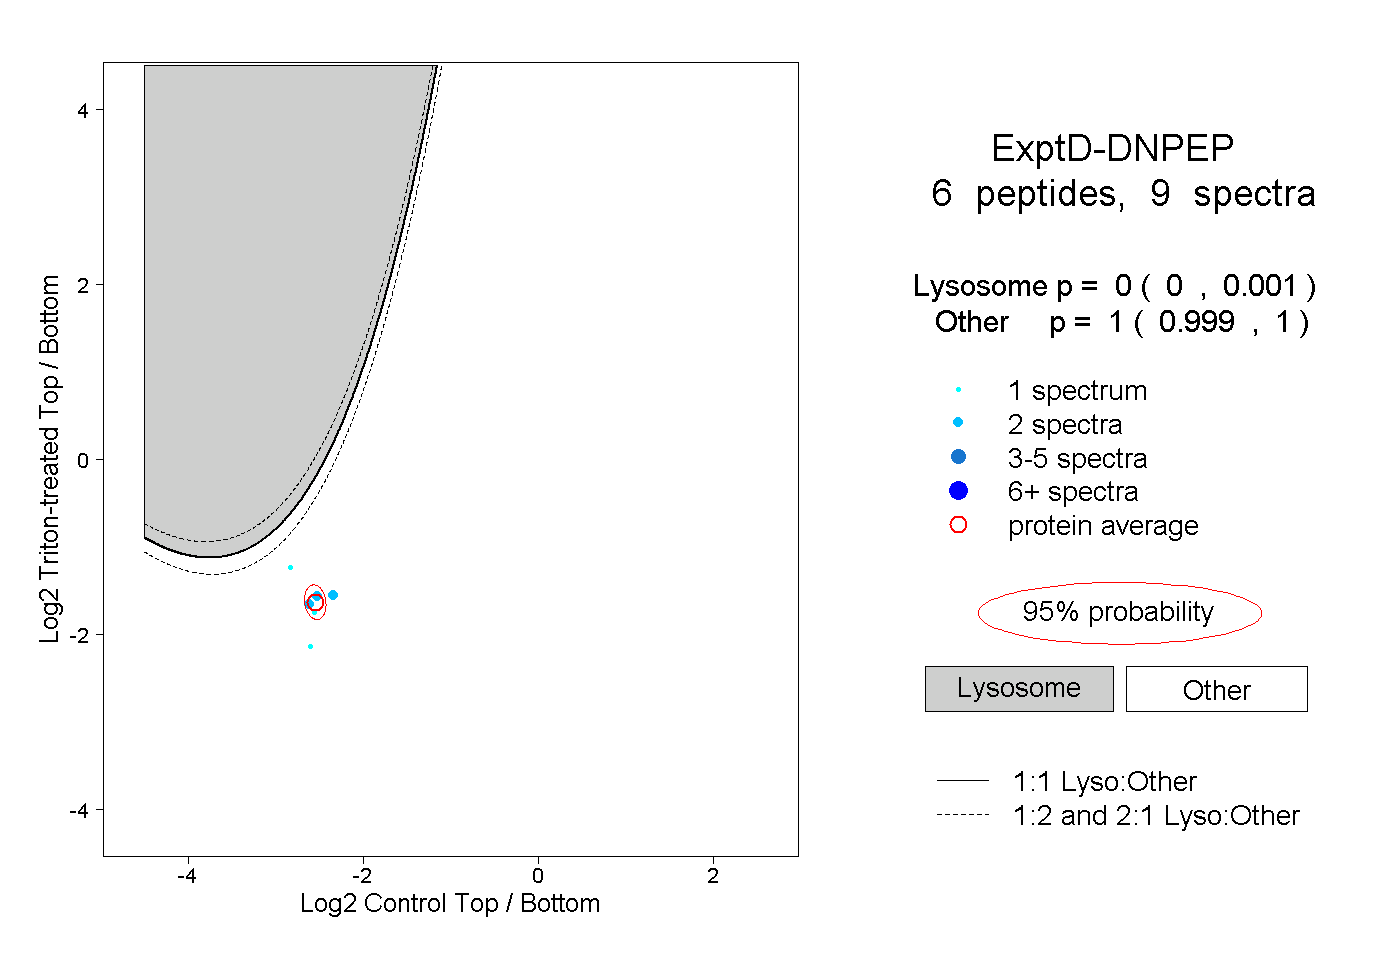
0.000 | 0.001
0.999 | 1.000