 5
5peptides
spectra
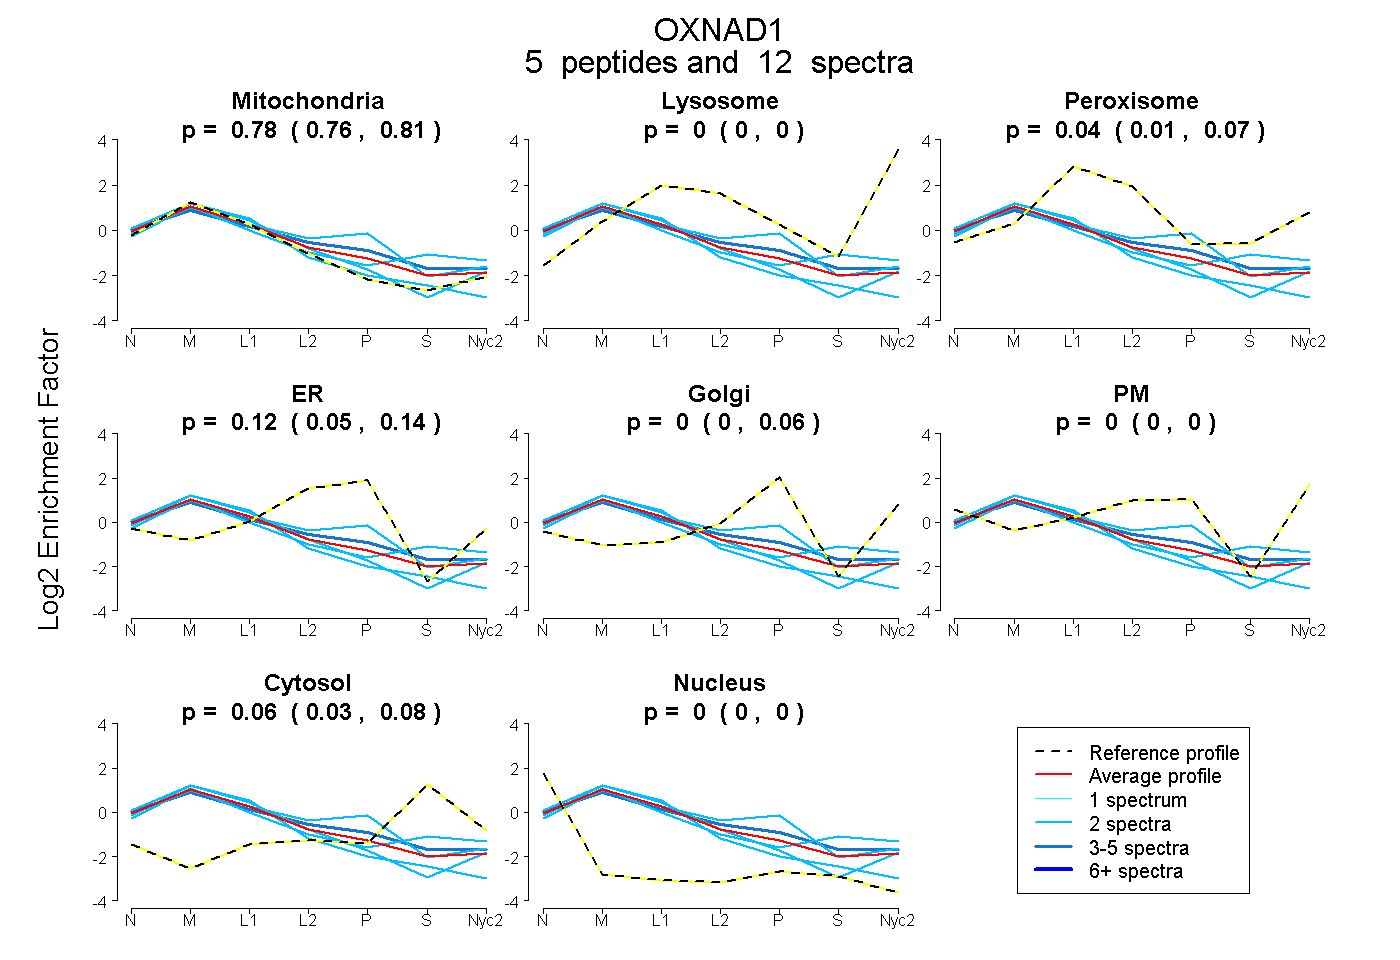
0.756 | 0.810
0.000 | 0.000
0.014 | 0.067
0.047 | 0.143
0.000 | 0.059
0.000 | 0.000
0.030 | 0.076
0.000 | 0.000
4peptides
spectra
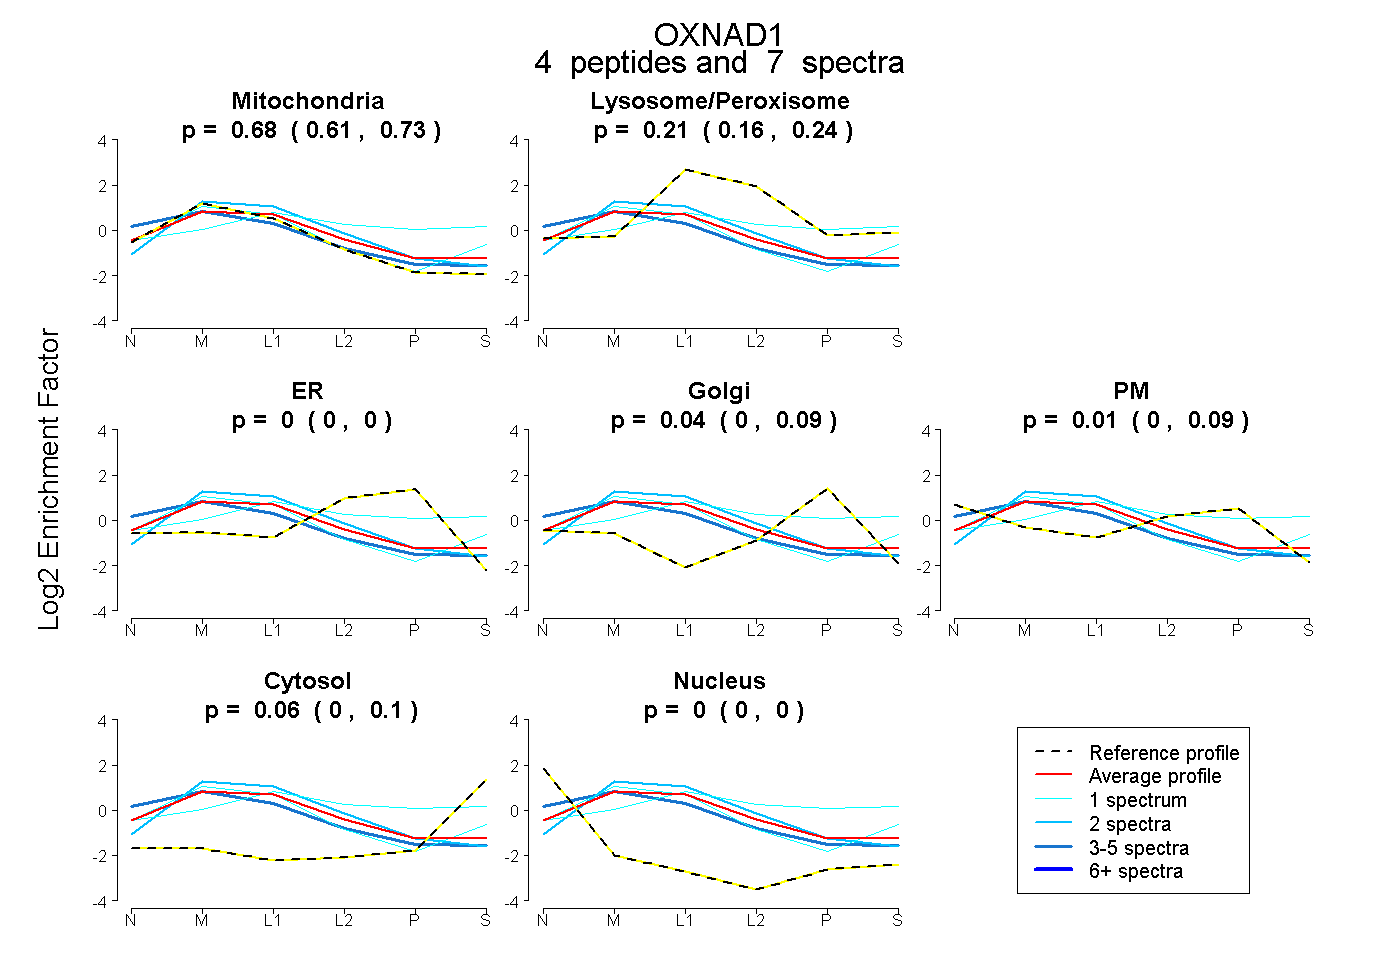
0.605 | 0.733
0.155 | 0.244
0.000 | 0.000
0.000 | 0.090
0.000 | 0.093
0.005 | 0.101
0.000 | 0.003
9peptides
spectra
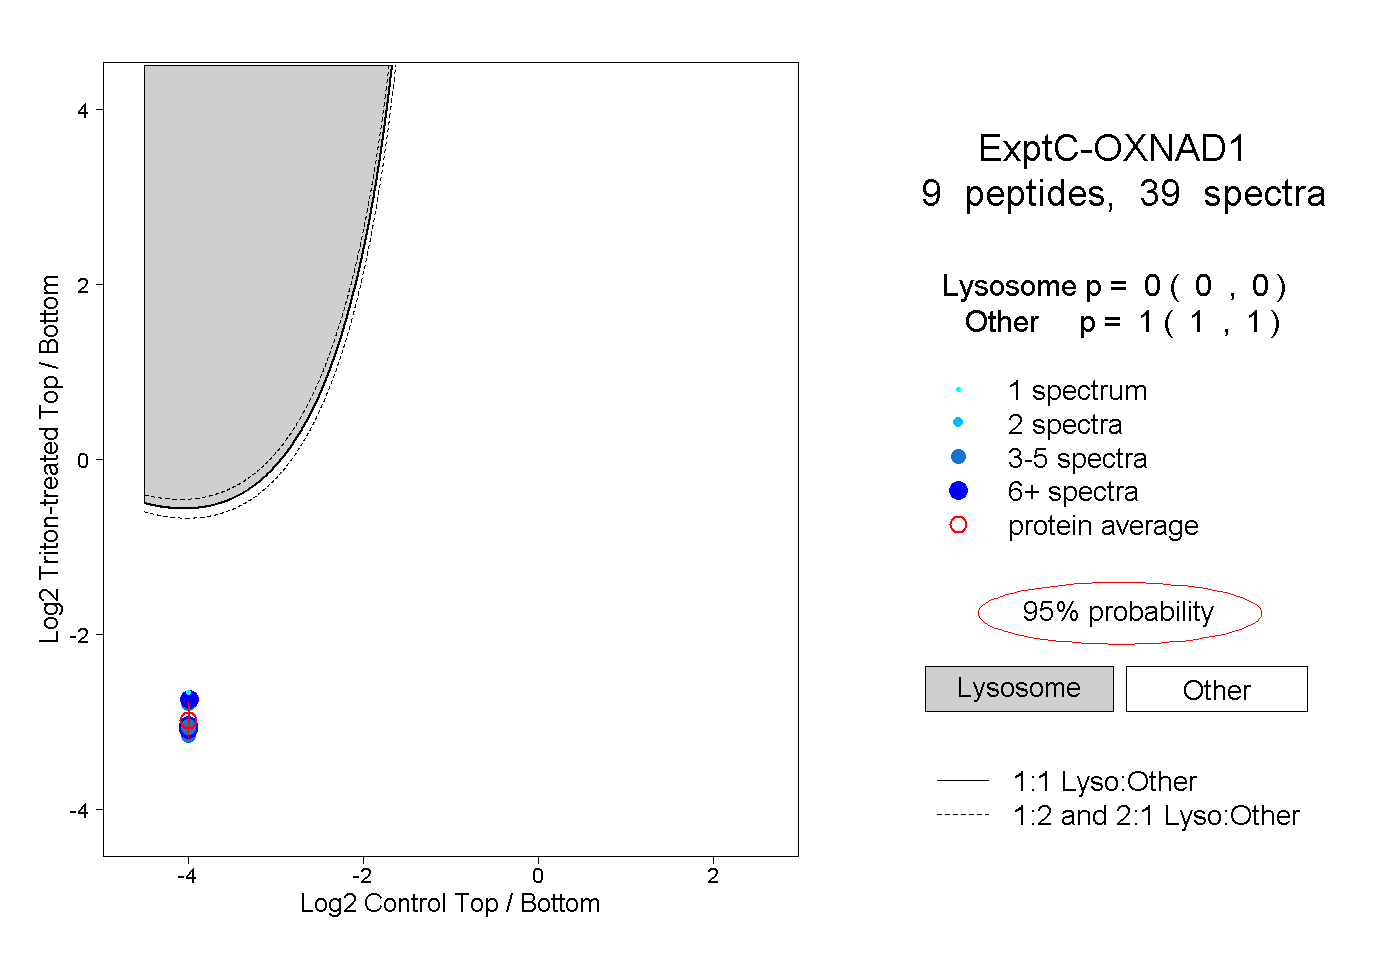
0.000 | 0.000
1.000 | 1.000
2peptides
spectra
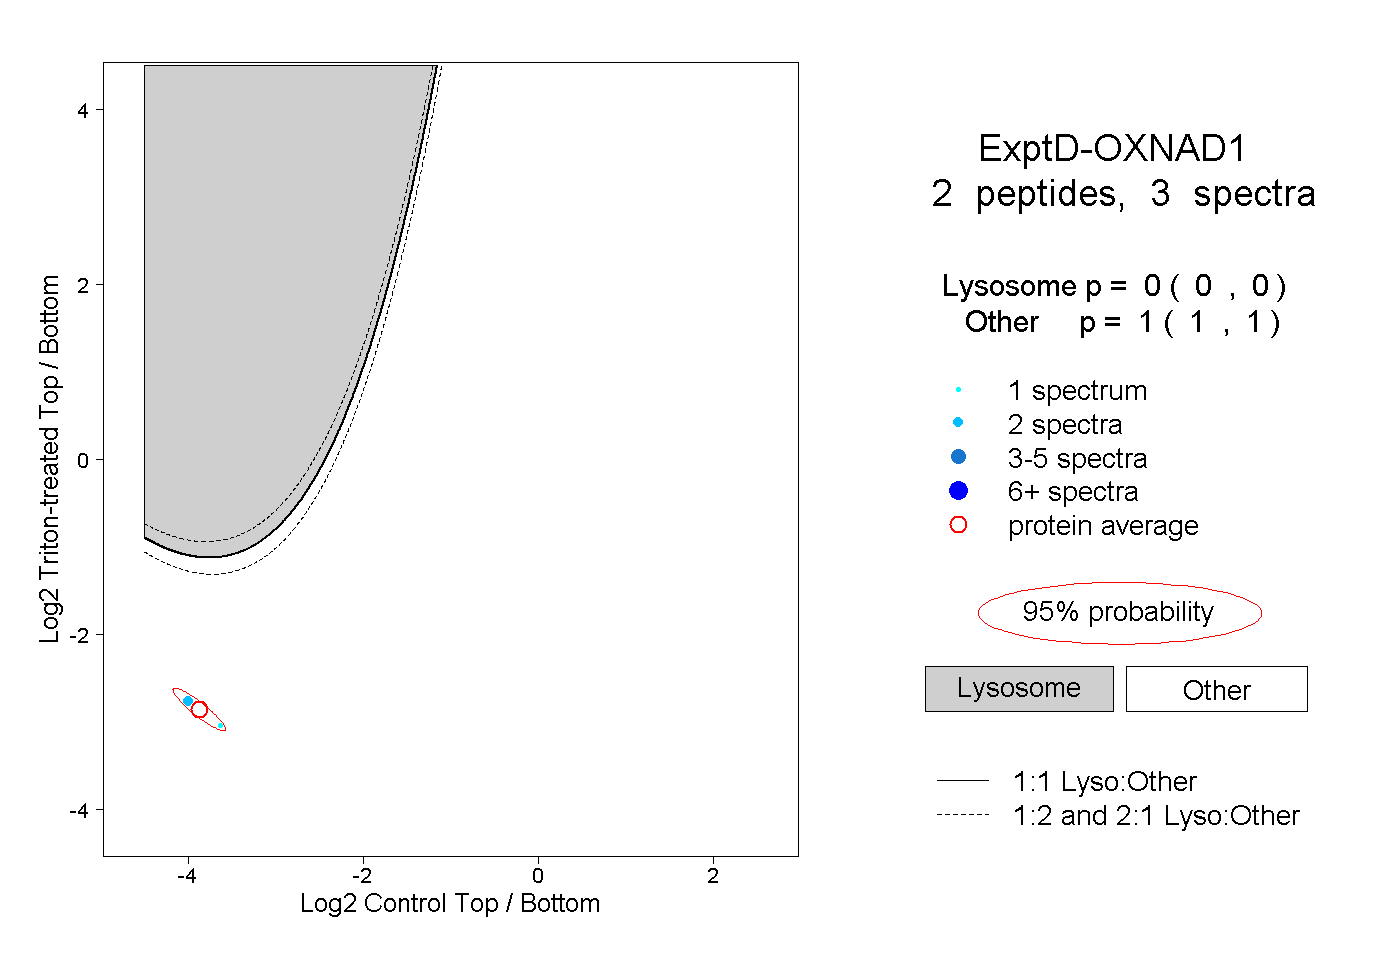
0.000 | 0.000
1.000 | 1.000