 5
5peptides
spectra
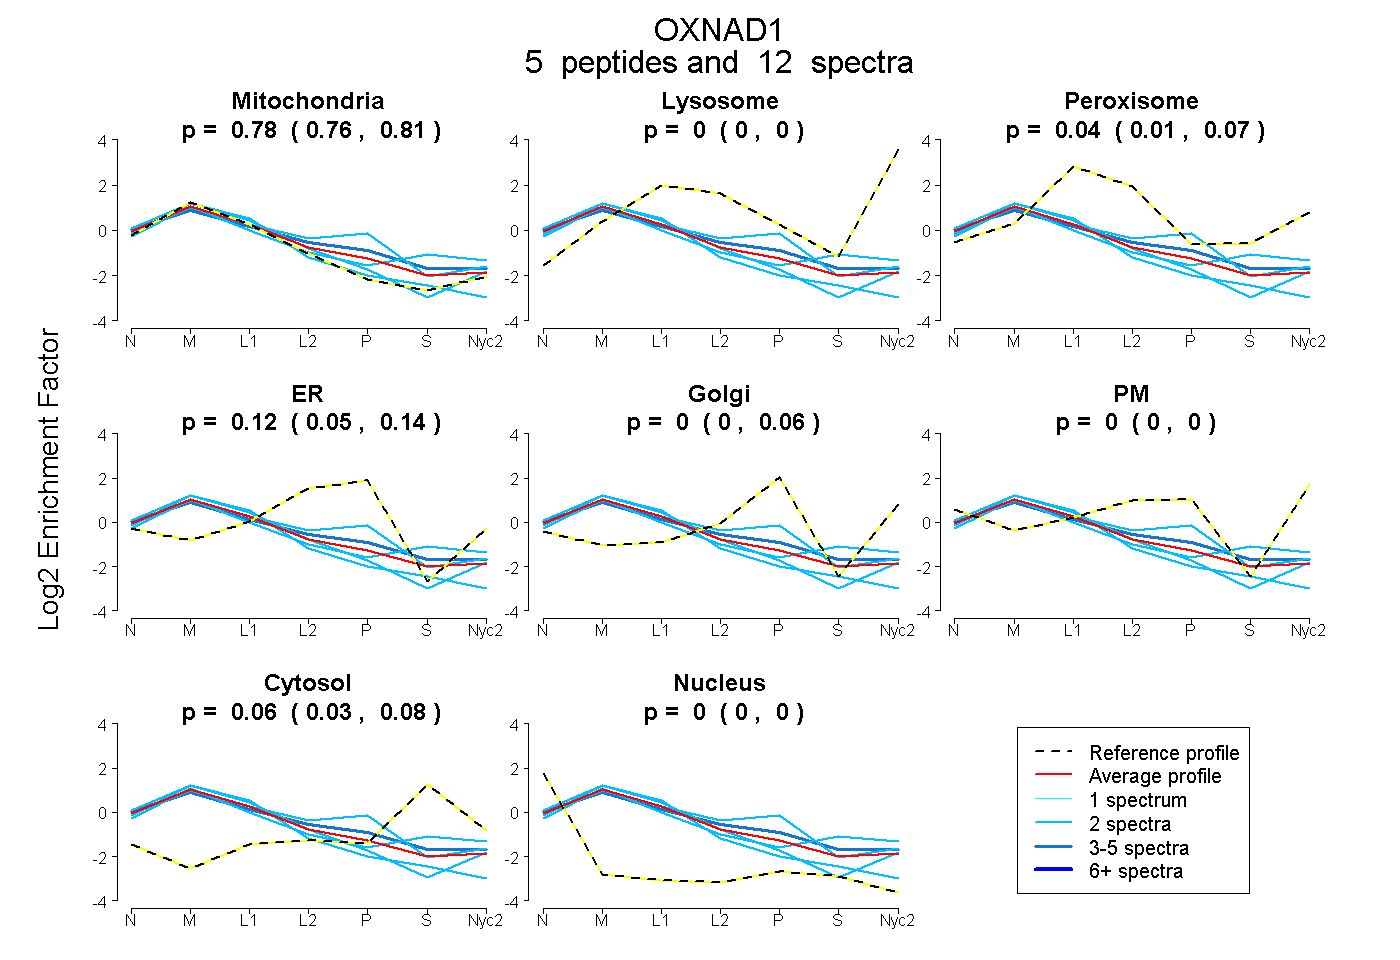
0.756 | 0.810
0.000 | 0.000
0.014 | 0.067
0.047 | 0.143
0.000 | 0.059
0.000 | 0.000
0.030 | 0.076
0.000 | 0.000
| Plot | Mito | Lyso | Perox | ER | Golgi | PM | Cytosol | Nucleus | |||||
| Expt A |
5 peptides |
12 spectra |
|
0.785 0.756 | 0.810 |
0.000 0.000 | 0.000 |
0.039 0.014 | 0.067 |
0.117 0.047 | 0.143 |
0.000 0.000 | 0.059 |
0.000 0.000 | 0.000 |
0.058 0.030 | 0.076 |
0.000 0.000 | 0.000 |
| 4 spectra, CTLDSEVALR | 0.675 | 0.000 | 0.051 | 0.179 | 0.002 | 0.000 | 0.093 | 0.000 | ||
| 2 spectra, YTNHPPAVWVHNK | 0.625 | 0.000 | 0.028 | 0.287 | 0.061 | 0.000 | 0.000 | 0.000 | ||
| 2 spectra, VGGEFFFDPQPTDAPR | 0.898 | 0.000 | 0.000 | 0.038 | 0.000 | 0.063 | 0.000 | 0.000 | ||
| 2 spectra, NTSELLFK | 0.690 | 0.038 | 0.068 | 0.000 | 0.000 | 0.000 | 0.203 | 0.000 | ||
| 2 spectra, NILDLVHEFPEK | 0.971 | 0.000 | 0.000 | 0.000 | 0.000 | 0.000 | 0.000 | 0.029 |
| Plot | Mito | Lyso or Perox | ER | Golgi | PM | Cytosol | Nucleus | ||||||
| Expt B |
4 peptides |
7 spectra |
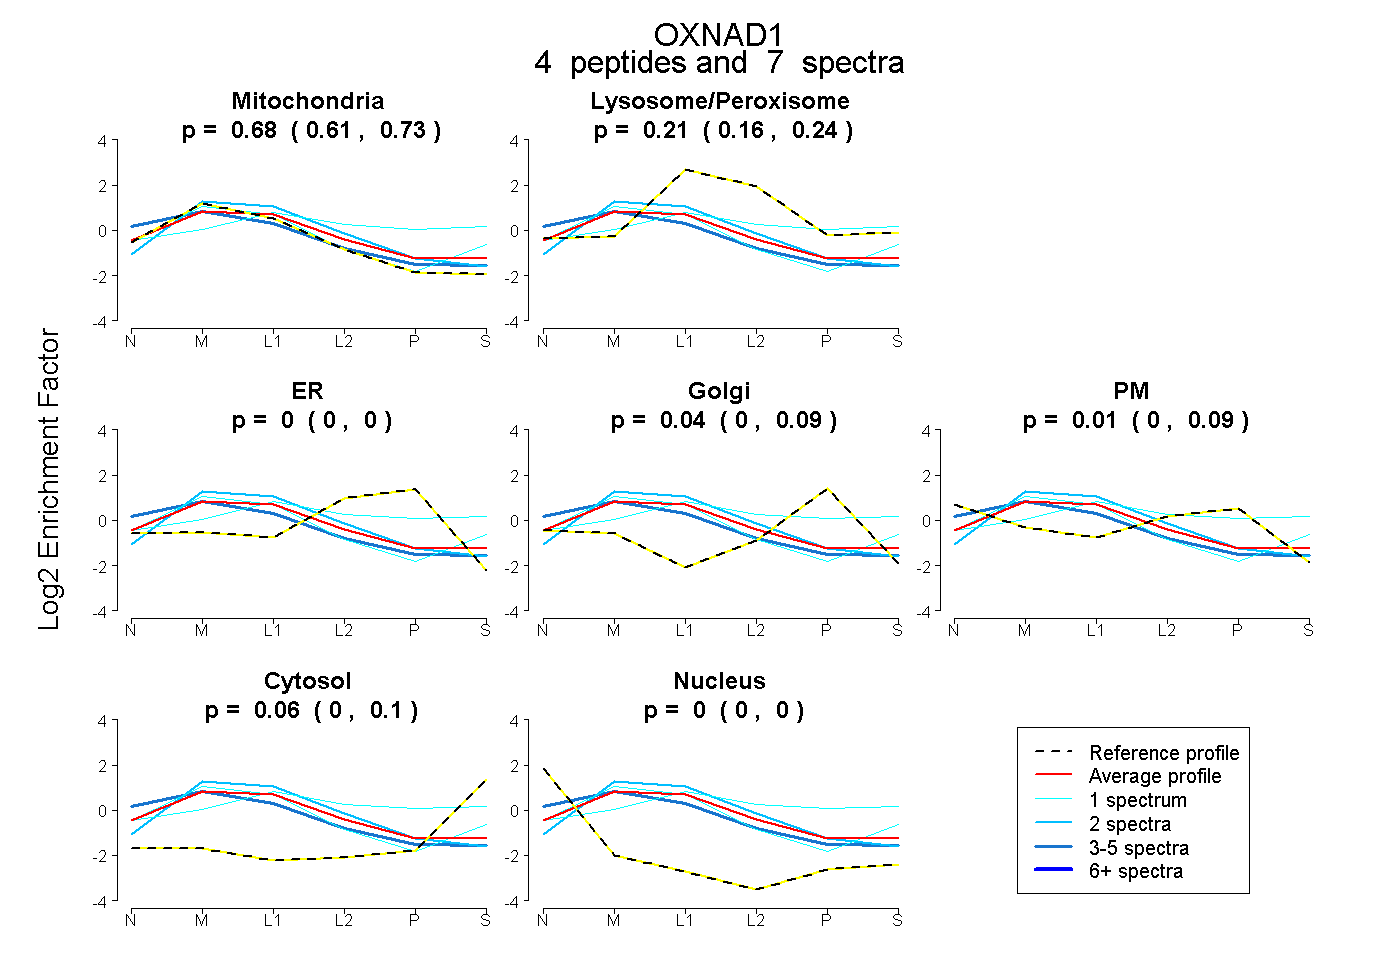 |
0.681 0.605 | 0.733 |
0.210 0.155 | 0.244 |
0.000 0.000 | 0.000 |
0.044 0.000 | 0.090 |
0.009 0.000 | 0.093 |
0.057 0.005 | 0.101 |
0.000 0.000 | 0.003 |
|||
| Plot | Lyso | Other | |||||||||||
| Expt C |
9 peptides |
39 spectra |
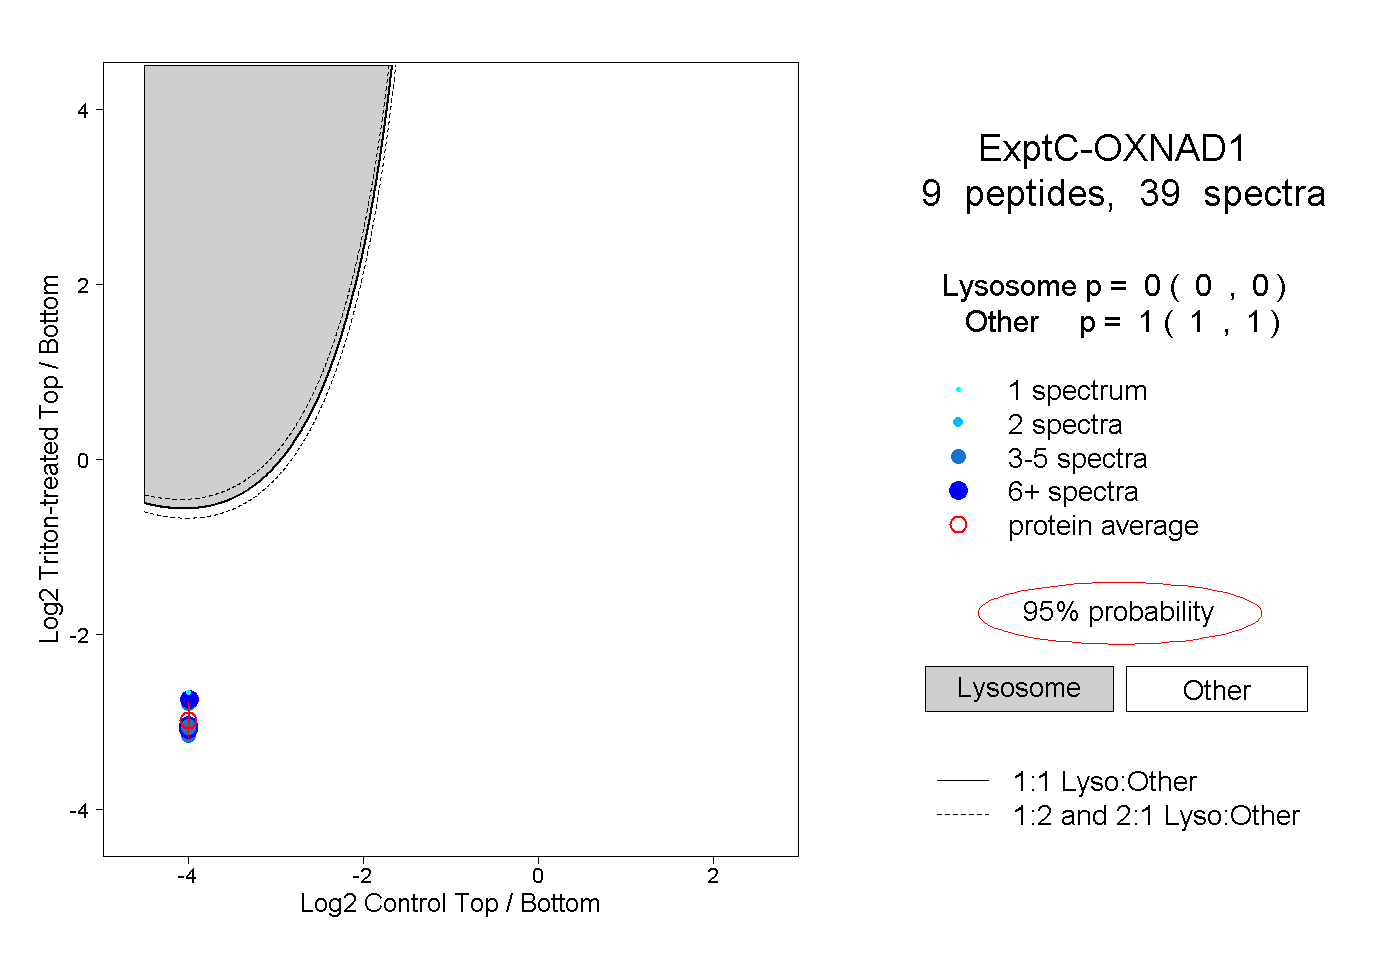 |
0.000 0.000 | 0.000 |
1.000 1.000 | 1.000 |
||||||||
| Plot | Lyso | Other | |||||||||||
| Expt D |
2 peptides |
3 spectra |
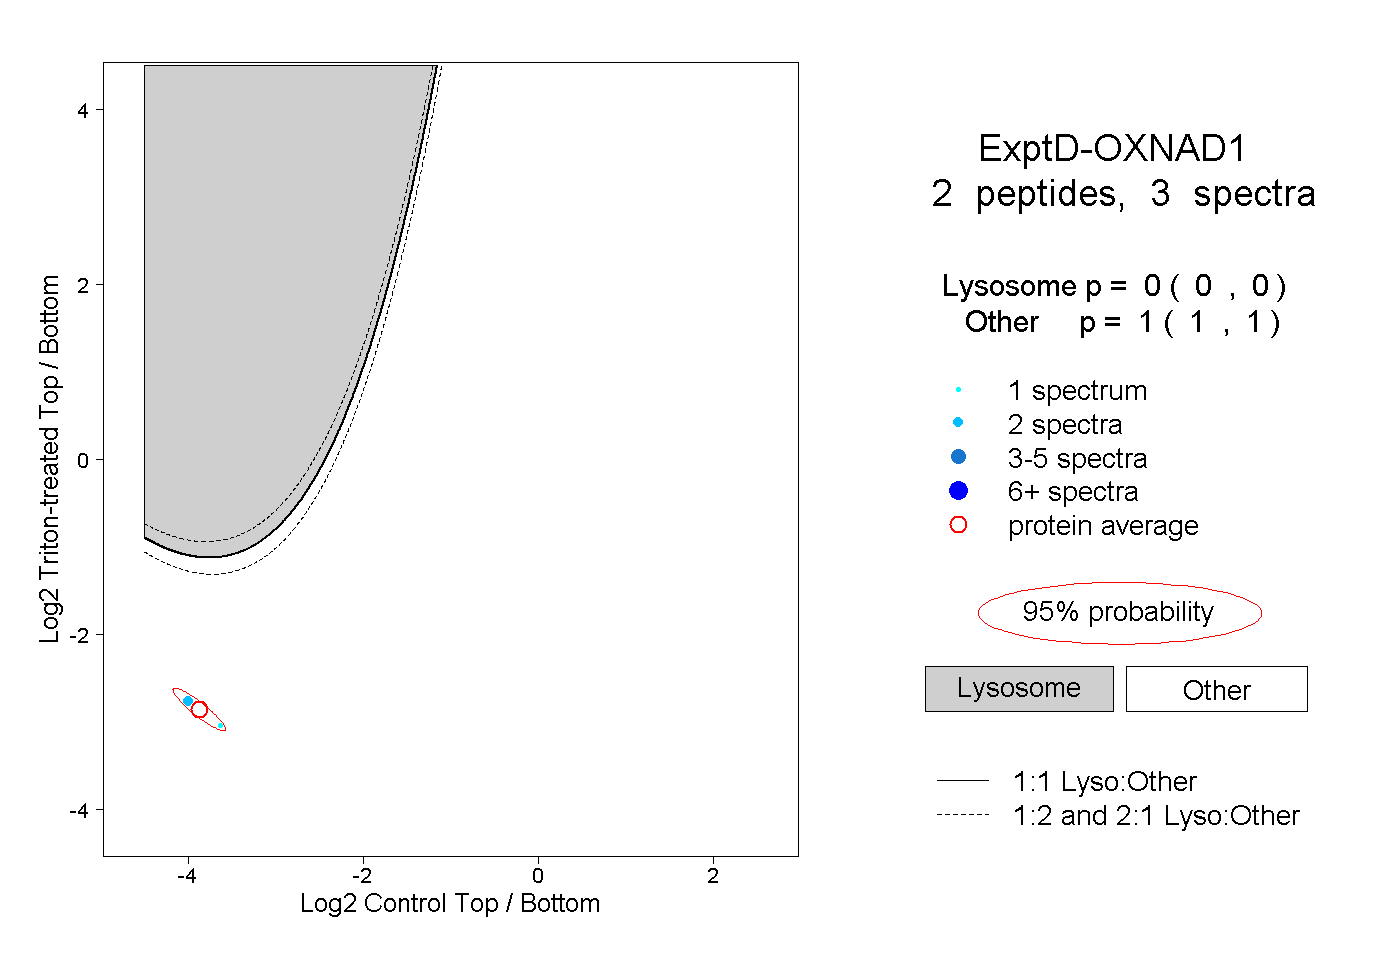 |
0.000 0.000 | 0.000 |
1.000 1.000 | 1.000 |