 7
7peptides
spectra
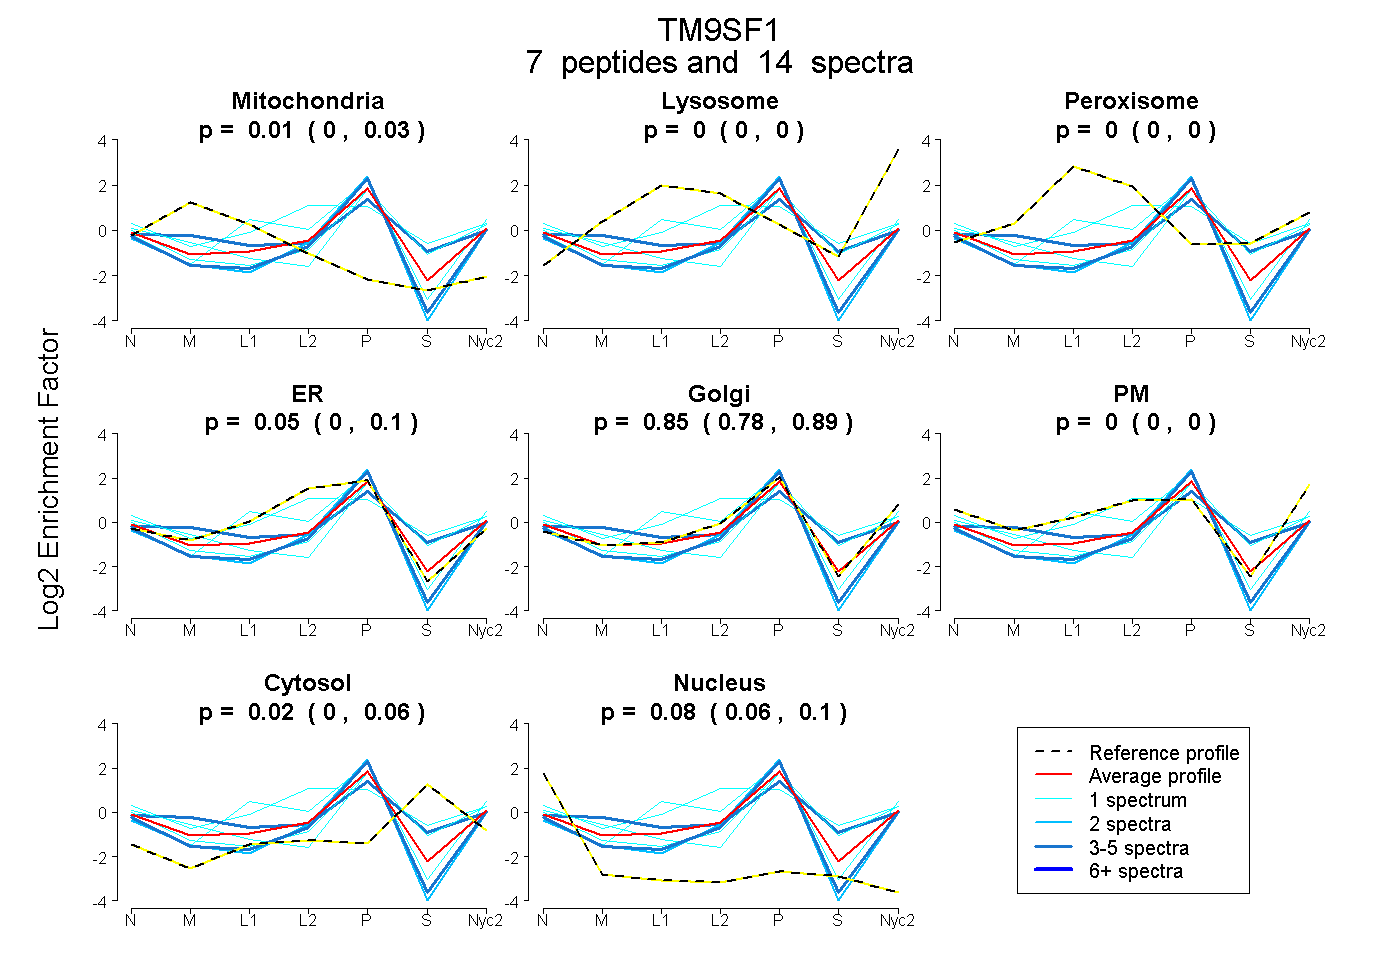
0.000 | 0.029
0.000 | 0.000
0.000 | 0.000
0.000 | 0.105
0.778 | 0.887
0.000 | 0.000
0.000 | 0.057
0.057 | 0.099
2peptides
spectra
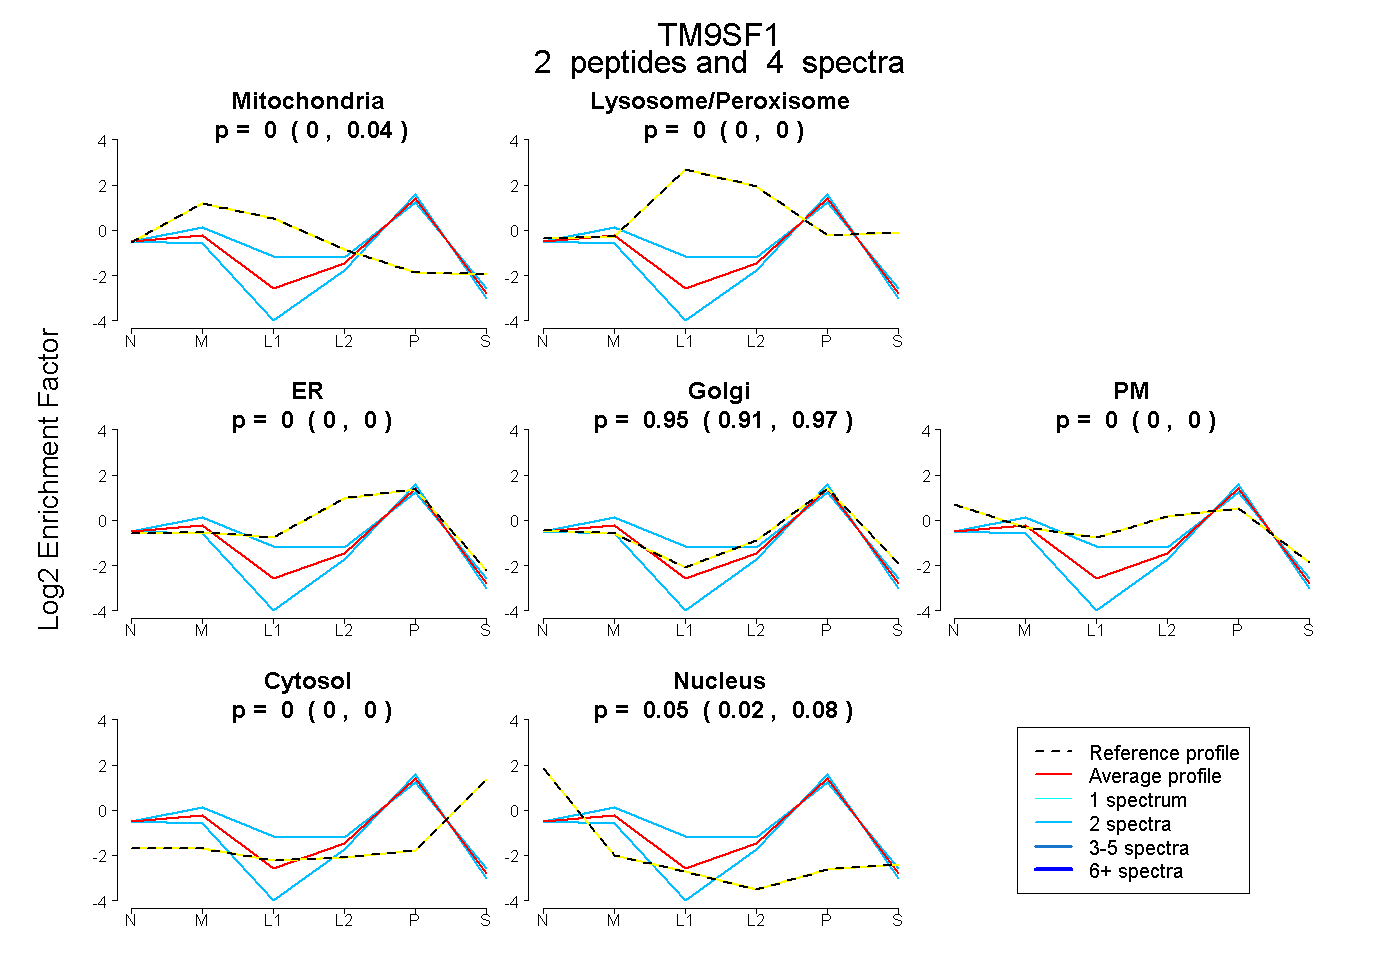
0.000 | 0.044
0.000 | 0.000
0.000 | 0.000
0.913 | 0.966
0.000 | 0.000
0.000 | 0.000
0.016 | 0.077
4peptides
spectra
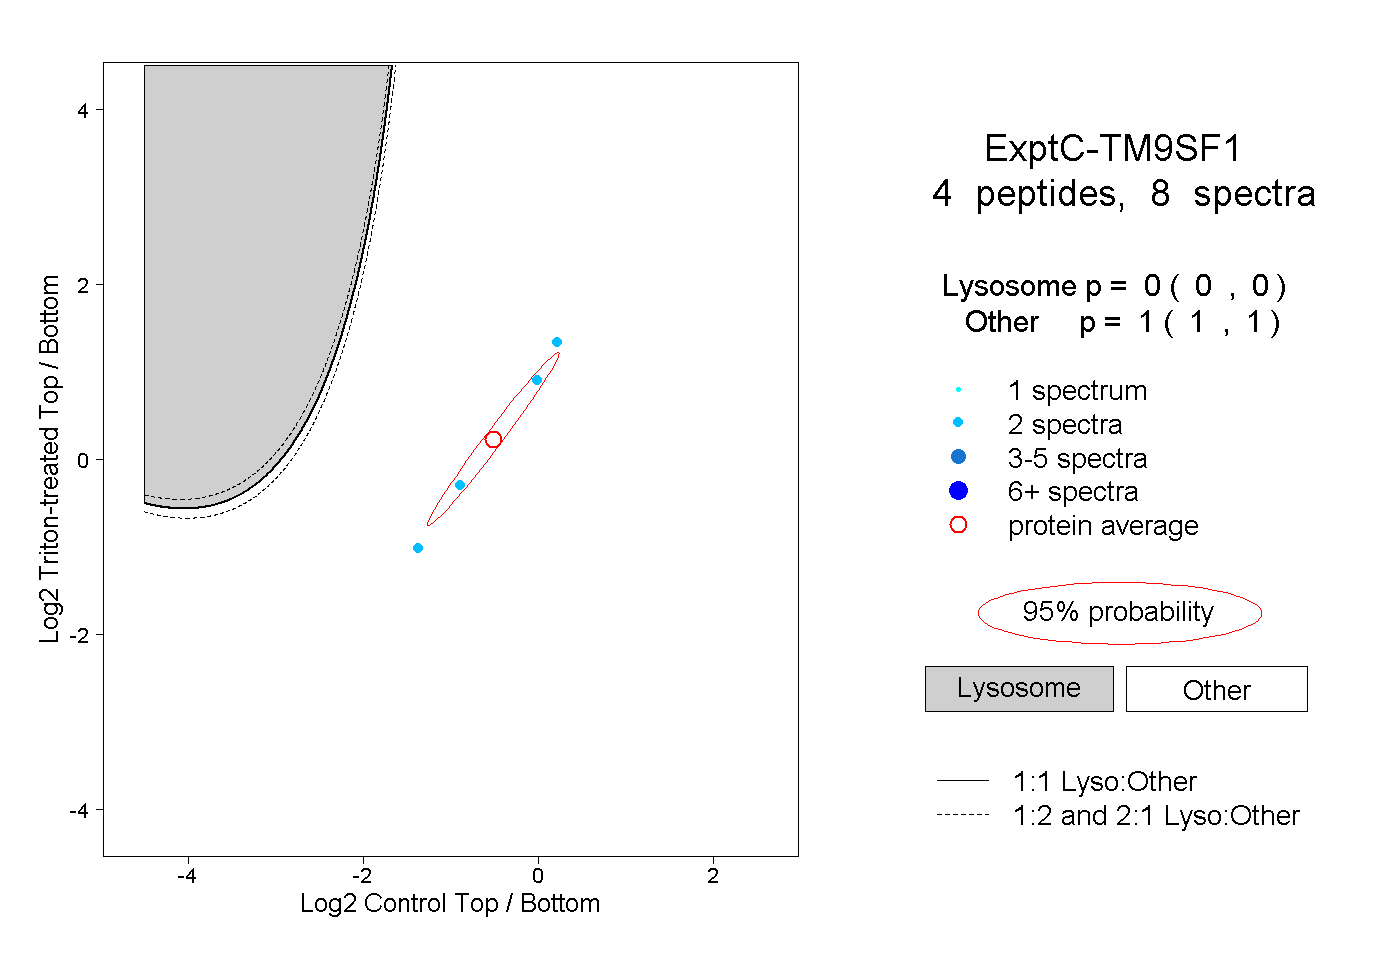
0.000 | 0.000
1.000 | 1.000