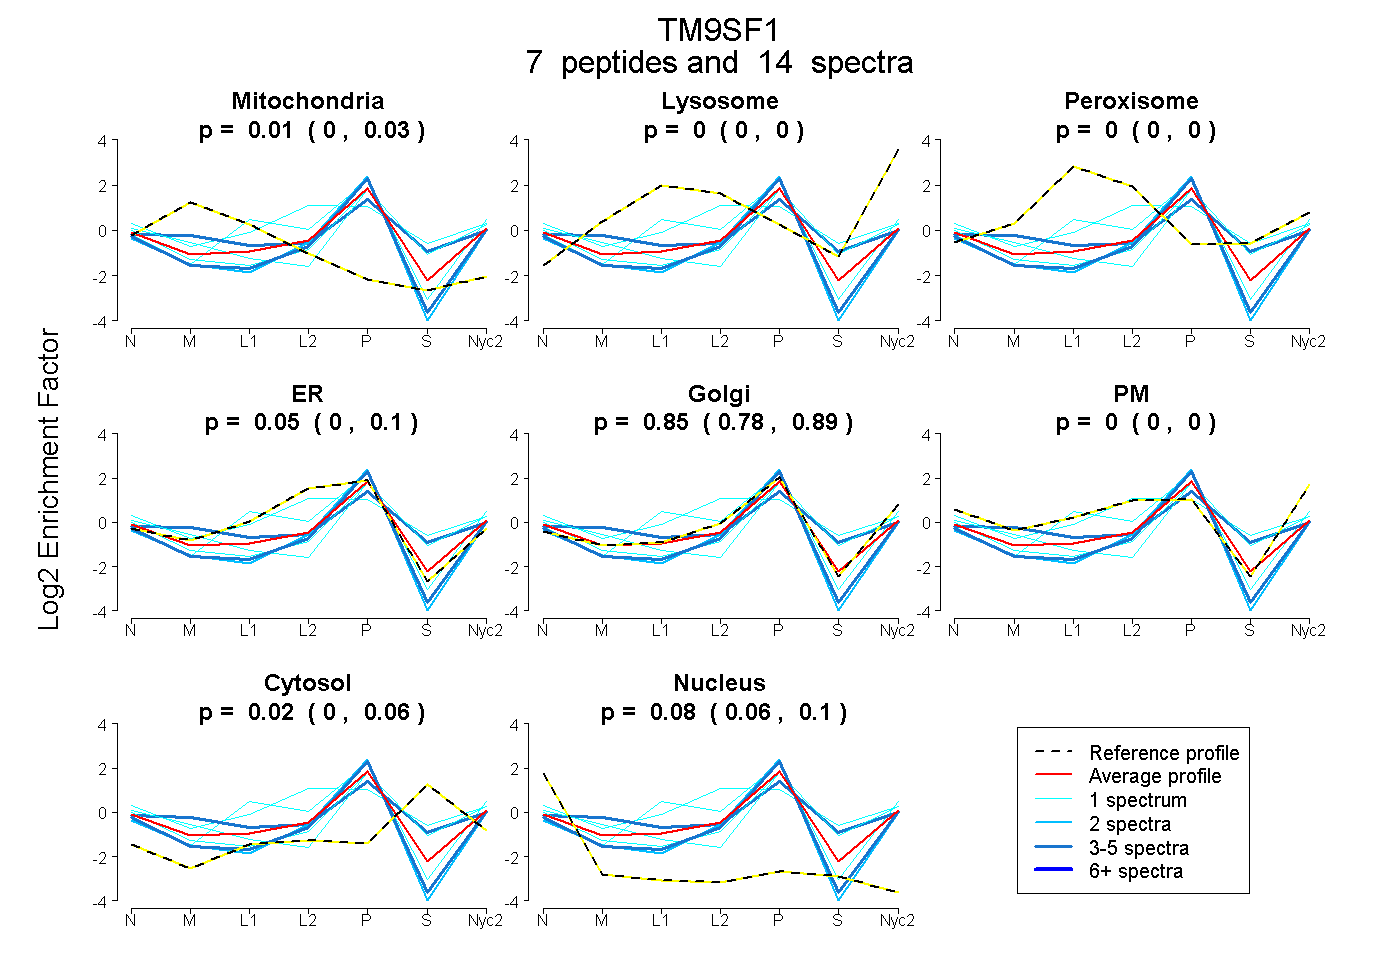
 7
7peptides
spectra
0.000 | 0.029
0.000 | 0.000
0.000 | 0.000
0.000 | 0.105
0.778 | 0.887
0.000 | 0.000
0.000 | 0.057
0.057 | 0.099
| Plot | Mito | Lyso | Perox | ER | Golgi | PM | Cytosol | Nucleus | |||||
| Expt A |
7 peptides |
14 spectra |
|
0.006 0.000 | 0.029 |
0.000 0.000 | 0.000 |
0.000 0.000 | 0.000 |
0.047 0.000 | 0.105 |
0.846 0.778 | 0.887 |
0.000 0.000 | 0.000 |
0.015 0.000 | 0.057 |
0.085 0.057 | 0.099 |
| 1 spectrum, MAESLYEIR | 0.000 | 0.000 | 0.000 | 0.000 | 0.749 | 0.000 | 0.214 | 0.037 | ||
| 4 spectra, IIHTDVFR | 0.106 | 0.000 | 0.065 | 0.000 | 0.650 | 0.000 | 0.179 | 0.000 | ||
| 1 spectrum, DVKPHSLDGLR | 0.000 | 0.000 | 0.002 | 0.350 | 0.600 | 0.048 | 0.000 | 0.000 | ||
| 2 spectra, NNASPFDAPCR | 0.000 | 0.000 | 0.000 | 0.000 | 0.888 | 0.000 | 0.000 | 0.112 | ||
| 4 spectra, SLSLGEVLDGDR | 0.000 | 0.000 | 0.000 | 0.000 | 0.880 | 0.000 | 0.000 | 0.120 | ||
| 1 spectrum, GLVHPR | 0.000 | 0.000 | 0.132 | 0.322 | 0.000 | 0.315 | 0.231 | 0.000 | ||
| 1 spectrum, SDELLGLTHTYSVR | 0.040 | 0.000 | 0.000 | 0.000 | 0.823 | 0.000 | 0.000 | 0.138 |
| Plot | Mito | Lyso or Perox | ER | Golgi | PM | Cytosol | Nucleus | ||||||
| Expt B |
2 peptides |
4 spectra |
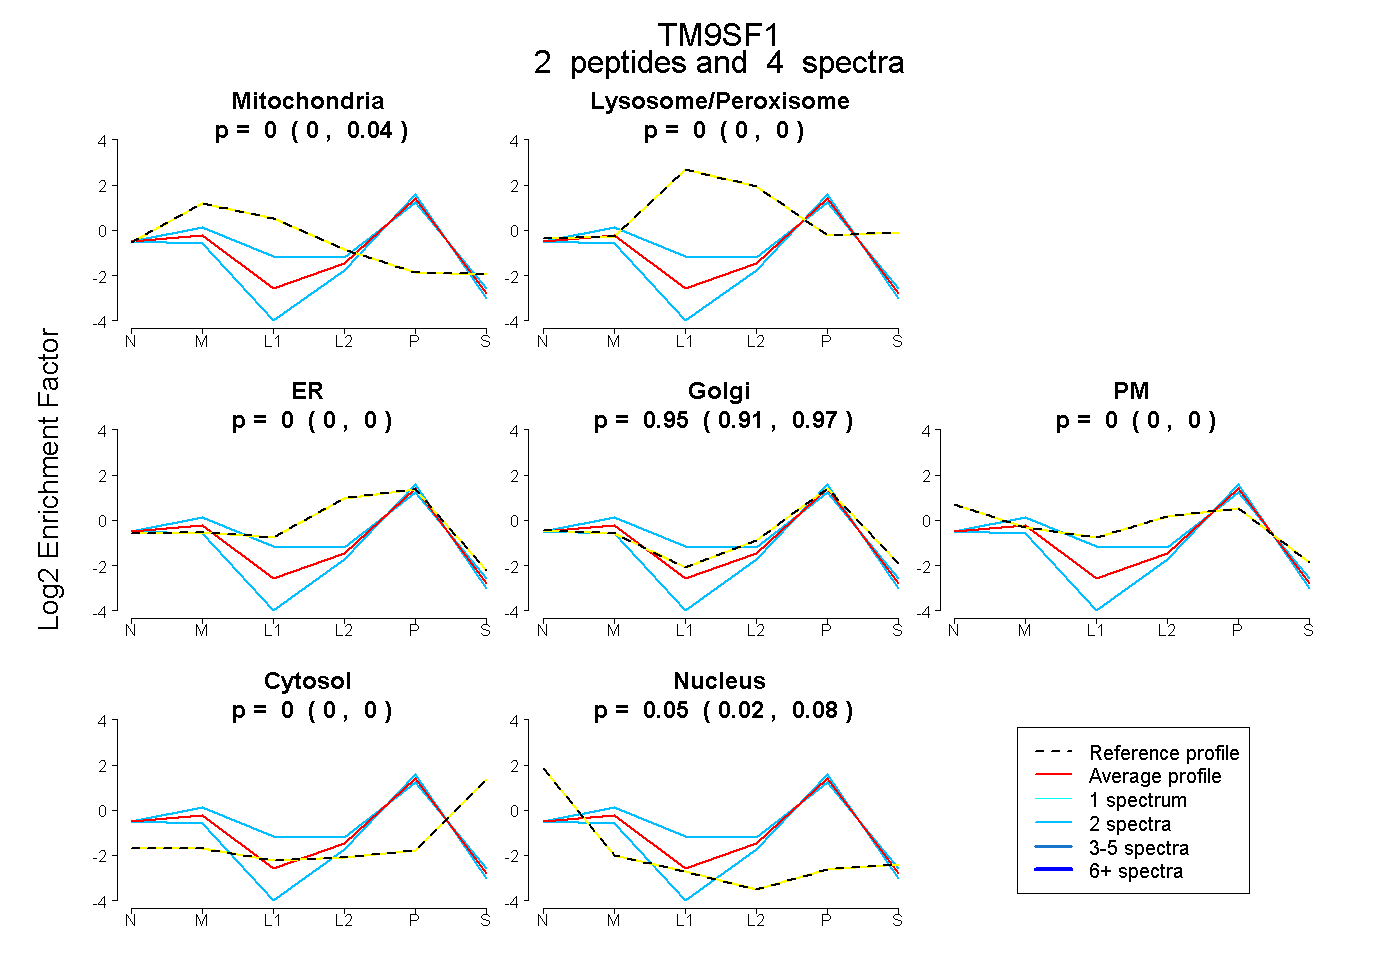 |
0.000 0.000 | 0.044 |
0.000 0.000 | 0.000 |
0.000 0.000 | 0.000 |
0.947 0.913 | 0.966 |
0.000 0.000 | 0.000 |
0.000 0.000 | 0.000 |
0.053 0.016 | 0.077 |
|||
| Plot | Lyso | Other | |||||||||||
| Expt C |
4 peptides |
8 spectra |
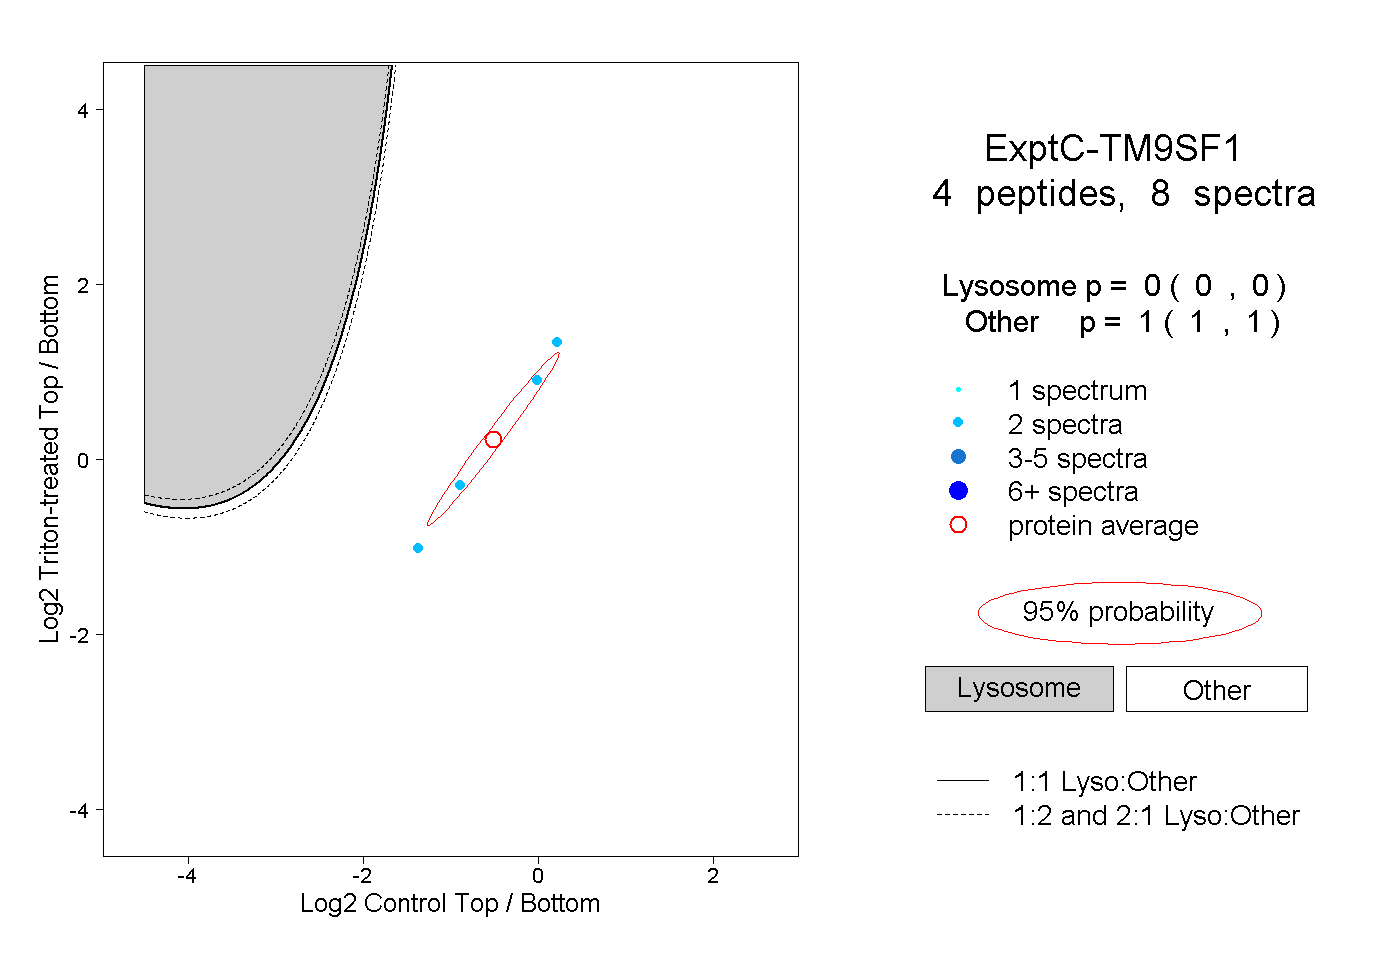 |
0.000 0.000 | 0.000 |
1.000 1.000 | 1.000 |