 10
10peptides
spectra
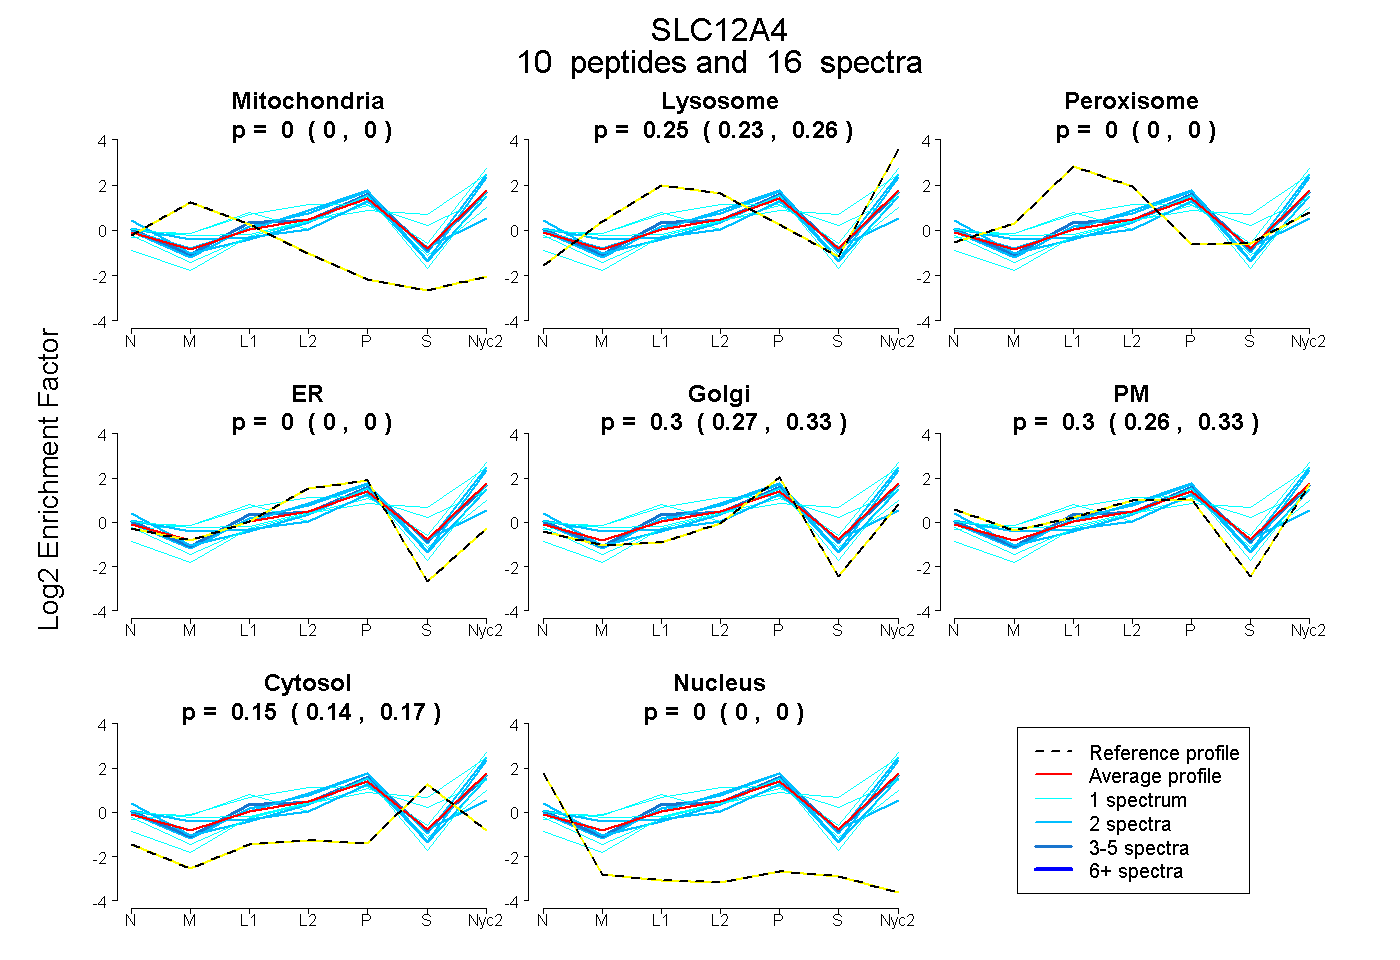
0.000 | 0.000
0.226 | 0.265
0.000 | 0.000
0.000 | 0.000
0.274 | 0.327
0.259 | 0.326
0.138 | 0.165
0.000 | 0.000
13peptides
spectra
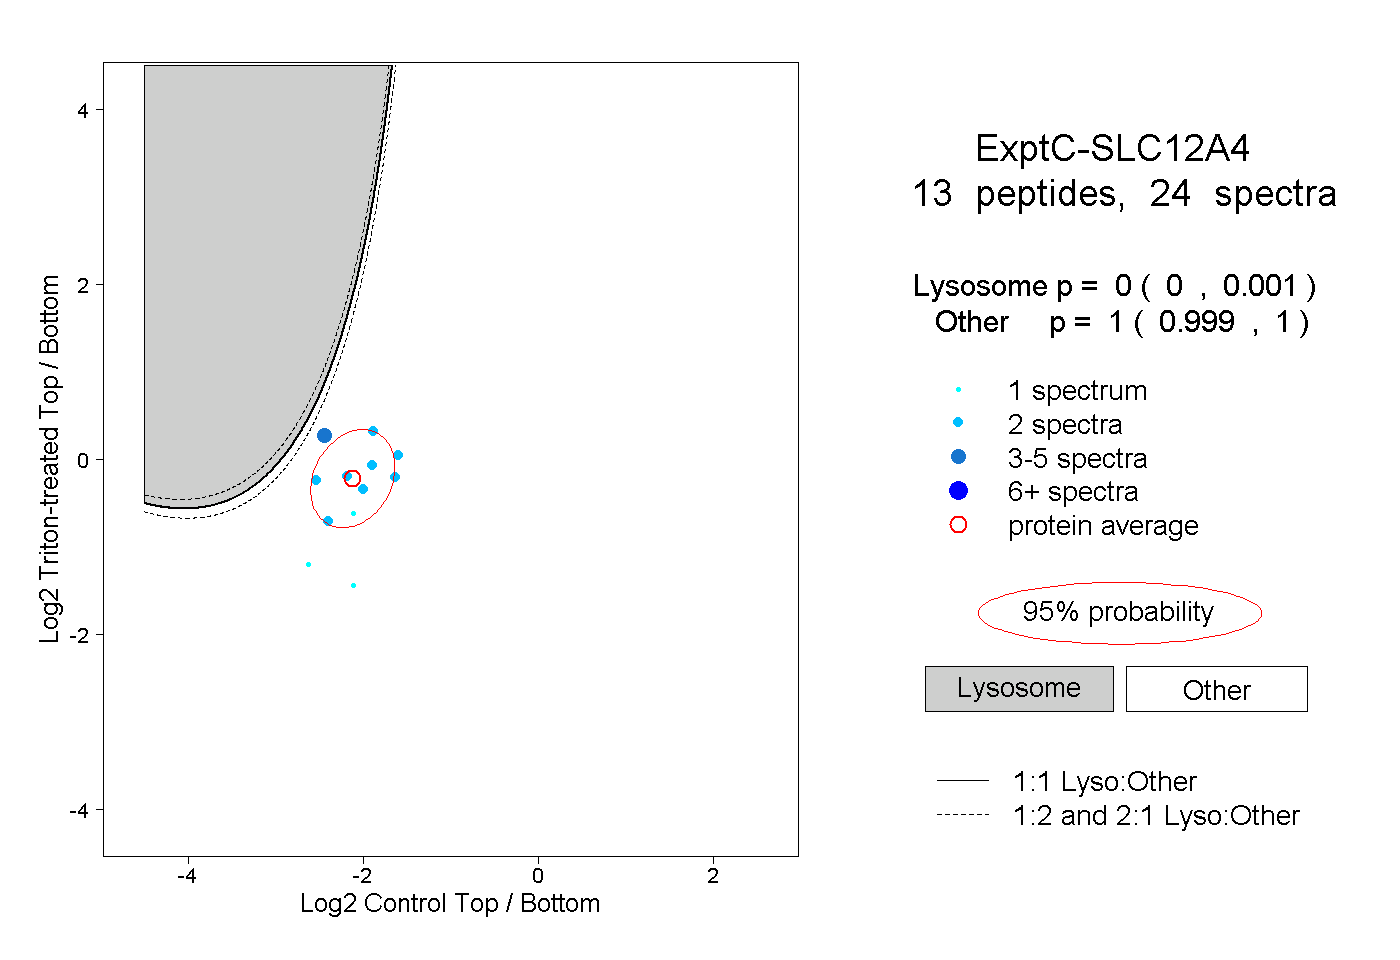
0.000 | 0.001
0.999 | 1.000
1peptide
spectrum
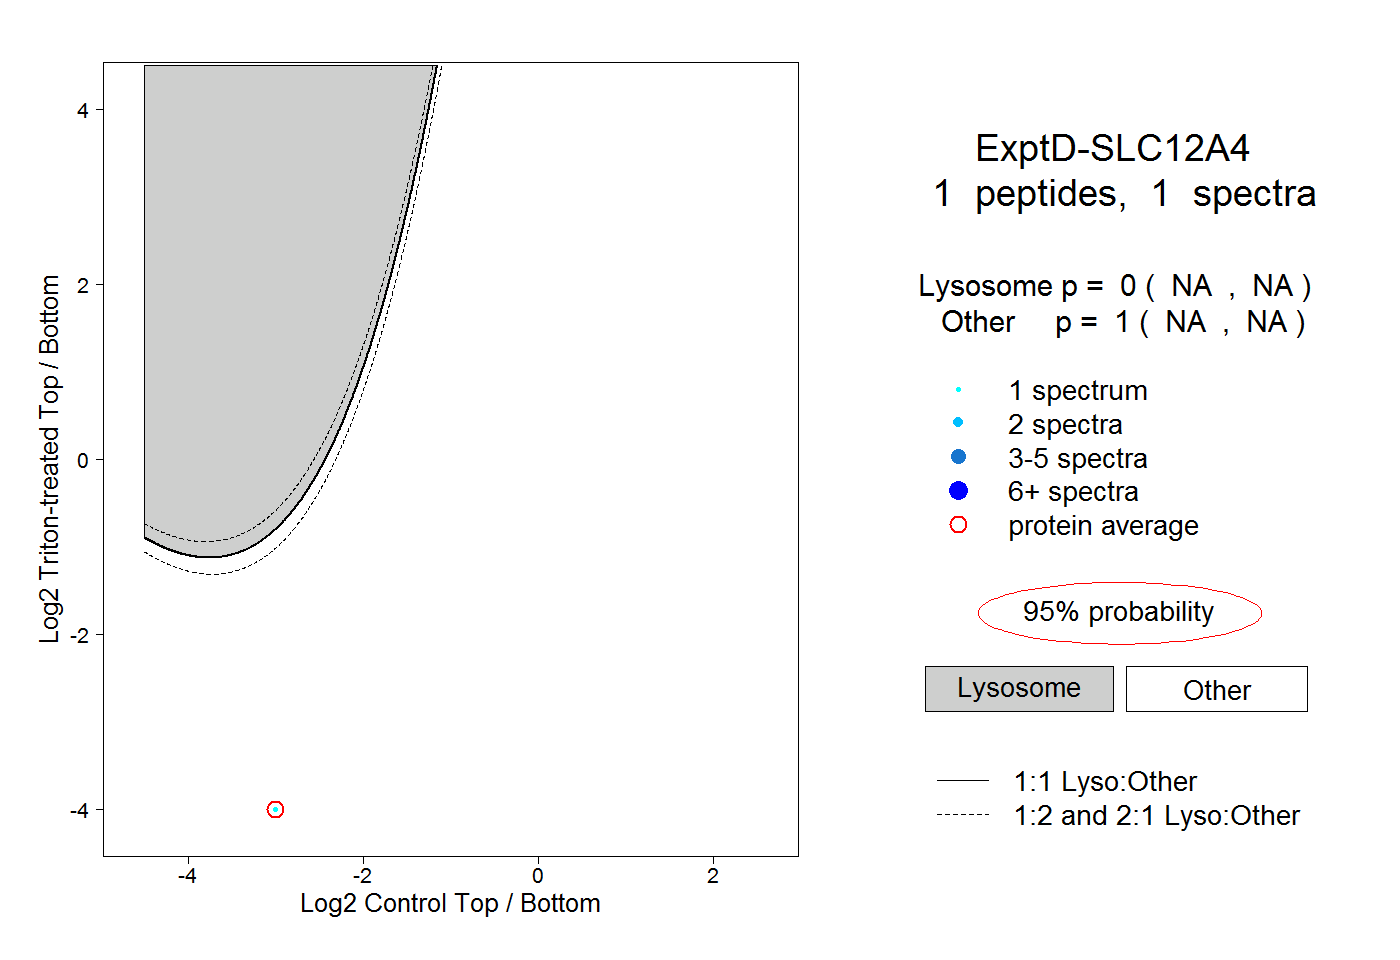
NA | NA
NA | NA