 10
10peptides
spectra
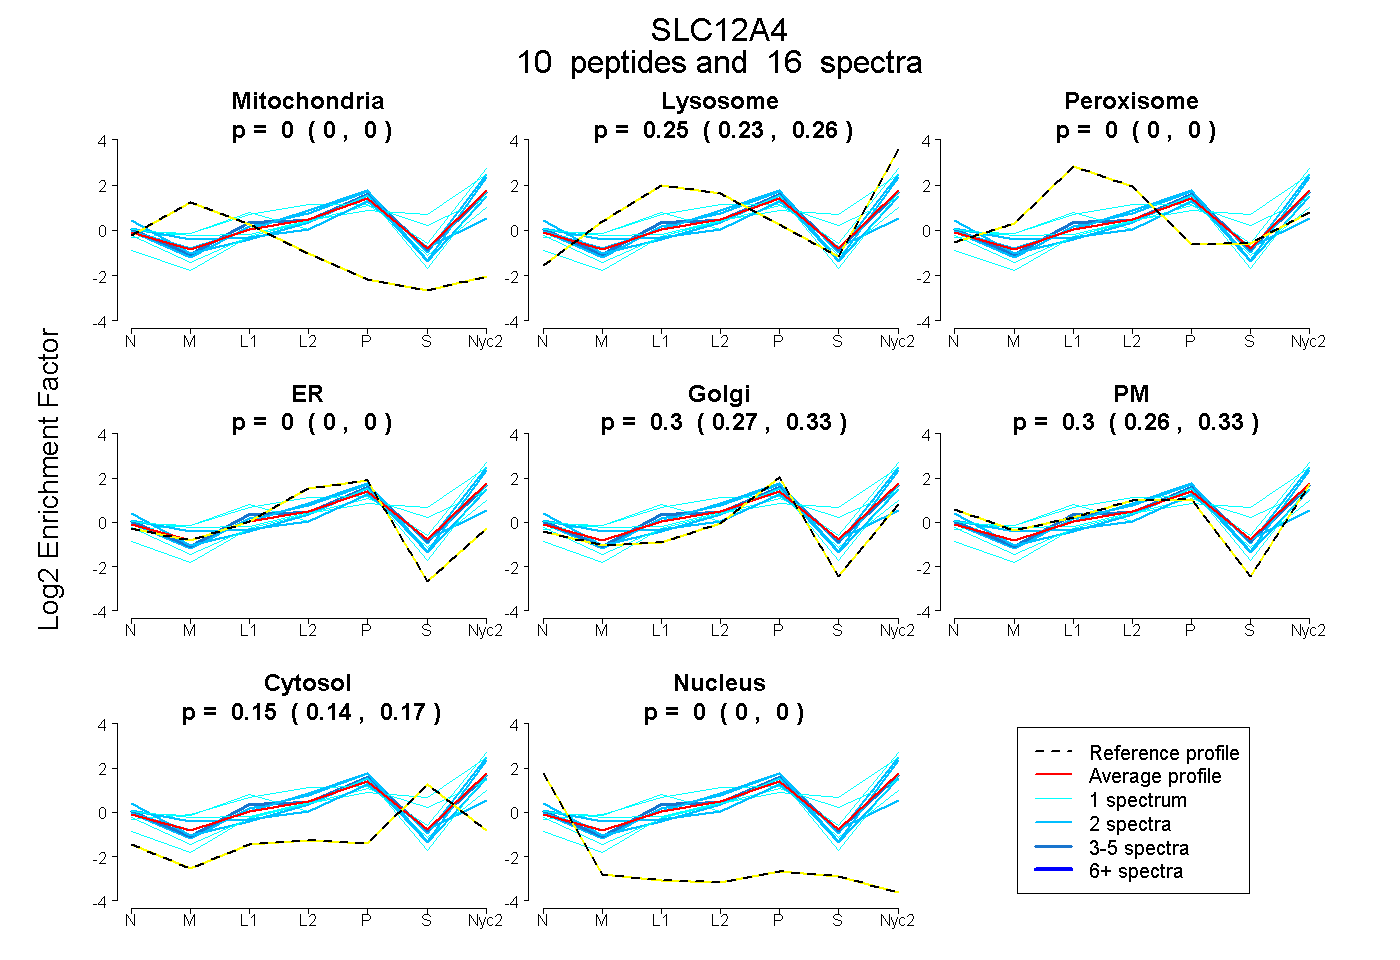
0.000 | 0.000
0.226 | 0.265
0.000 | 0.000
0.000 | 0.000
0.274 | 0.327
0.259 | 0.326
0.138 | 0.165
0.000 | 0.000
| Plot | Mito | Lyso | Perox | ER | Golgi | PM | Cytosol | Nucleus | |||||
| Expt A |
10 peptides |
16 spectra |
|
0.000 0.000 | 0.000 |
0.247 0.226 | 0.265 |
0.000 0.000 | 0.000 |
0.000 0.000 | 0.000 |
0.303 0.274 | 0.327 |
0.296 0.259 | 0.326 |
0.153 0.138 | 0.165 |
0.000 0.000 | 0.000 |
| 1 spectrum, LVSYTNLTQGAK | 0.000 | 0.229 | 0.000 | 0.000 | 0.208 | 0.211 | 0.352 | 0.000 | ||
| 1 spectrum, LLQAIAK | 0.000 | 0.452 | 0.000 | 0.000 | 0.165 | 0.000 | 0.384 | 0.000 | ||
| 3 spectra, GLSLSAAR | 0.000 | 0.207 | 0.022 | 0.000 | 0.328 | 0.309 | 0.133 | 0.000 | ||
| 1 spectrum, TFIDTVR | 0.000 | 0.153 | 0.000 | 0.000 | 0.418 | 0.403 | 0.026 | 0.000 | ||
| 1 spectrum, DLAIFLYHLR | 0.000 | 0.030 | 0.363 | 0.000 | 0.557 | 0.029 | 0.021 | 0.000 | ||
| 2 spectra, PHFTVVPVDGPR | 0.000 | 0.000 | 0.151 | 0.000 | 0.468 | 0.189 | 0.192 | 0.000 | ||
| 2 spectra, VFGHGK | 0.000 | 0.293 | 0.000 | 0.000 | 0.427 | 0.272 | 0.009 | 0.000 | ||
| 1 spectrum, HGLPSTDTLGLK | 0.000 | 0.529 | 0.000 | 0.000 | 0.088 | 0.302 | 0.081 | 0.000 | ||
| 2 spectra, DNIIPFLR | 0.000 | 0.325 | 0.000 | 0.000 | 0.397 | 0.219 | 0.058 | 0.000 | ||
| 2 spectra, LDEDLHVK | 0.000 | 0.004 | 0.000 | 0.000 | 0.304 | 0.567 | 0.124 | 0.000 |
| Plot | Lyso | Other | |||||||||||
| Expt C |
13 peptides |
24 spectra |
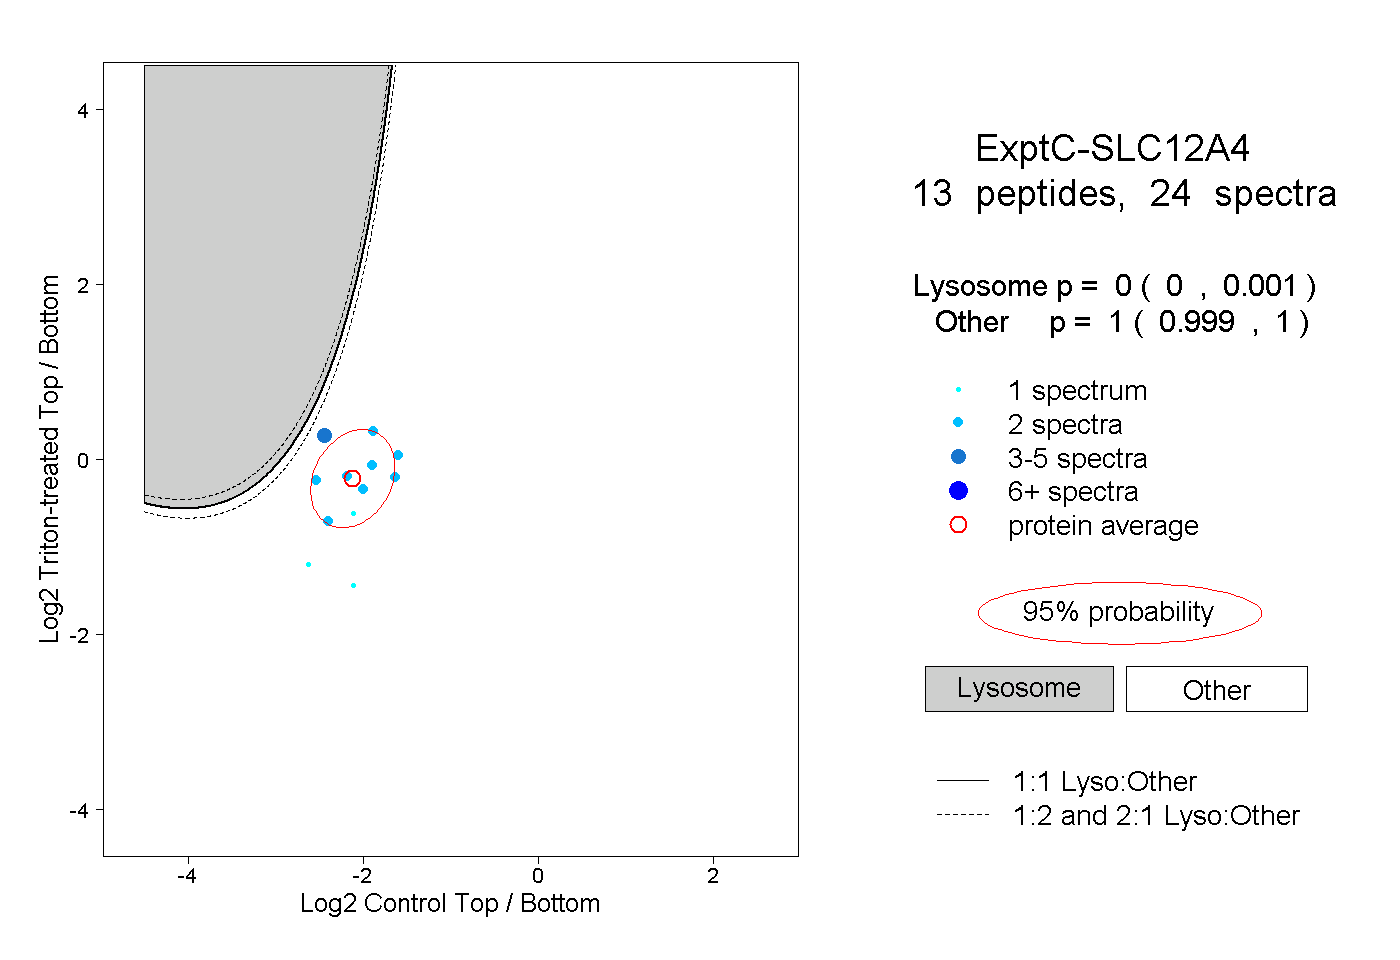 |
0.000 0.000 | 0.001 |
1.000 0.999 | 1.000 |
||||||||
| Plot | Lyso | Other | |||||||||||
| Expt D |
1 peptide |
1 spectrum |
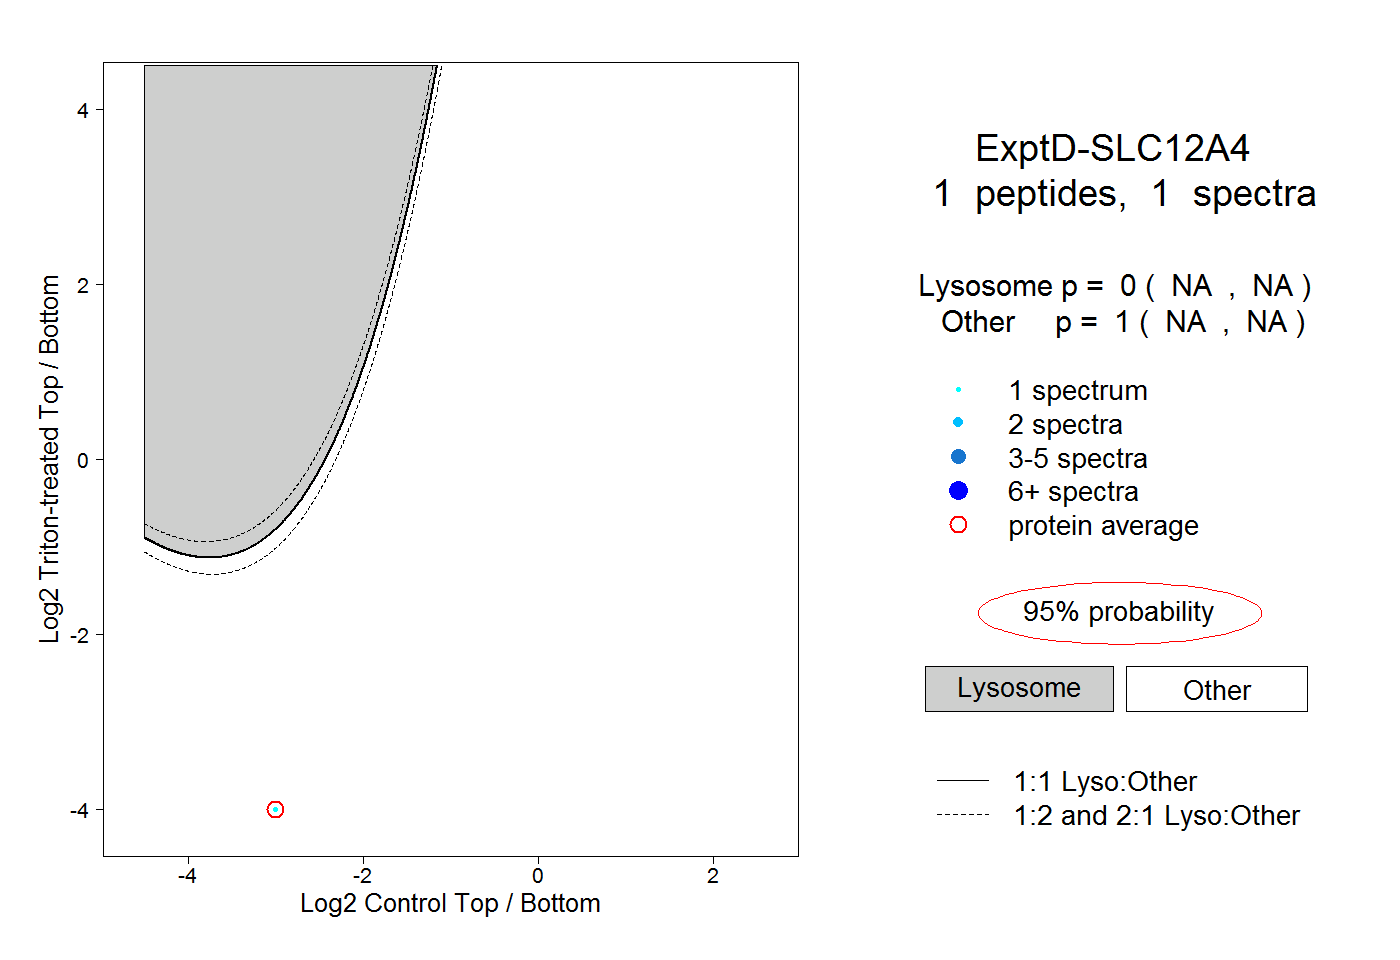 |
0.000 NA | NA |
1.000 NA | NA |