 42
42peptides
spectra
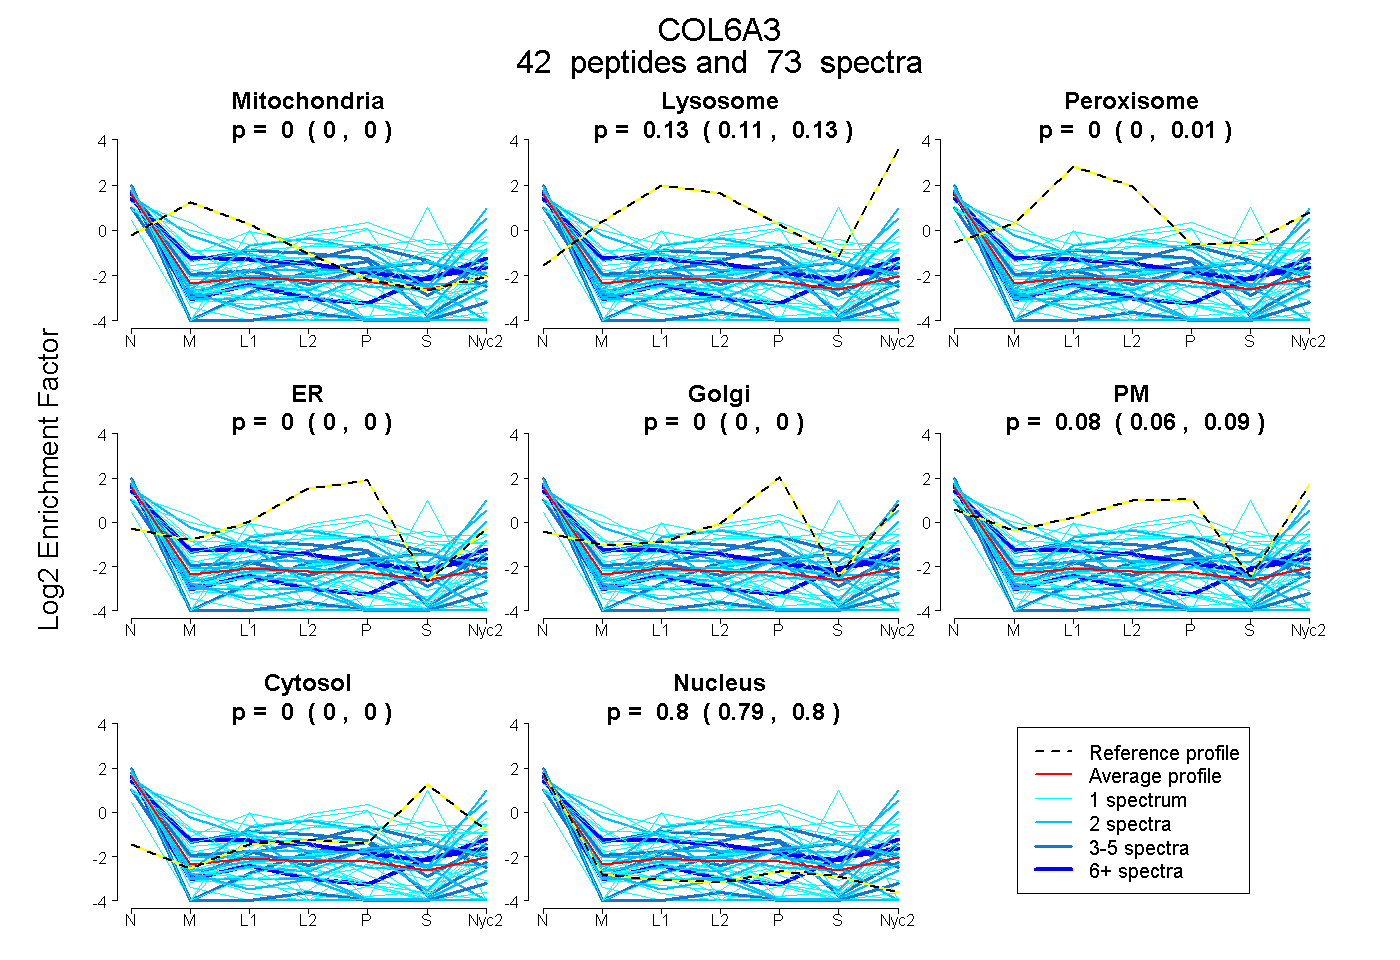
0.000 | 0.000
0.108 | 0.135
0.000 | 0.015
0.000 | 0.000
0.000 | 0.000
0.061 | 0.090
0.000 | 0.000
0.789 | 0.800
9peptides
spectra
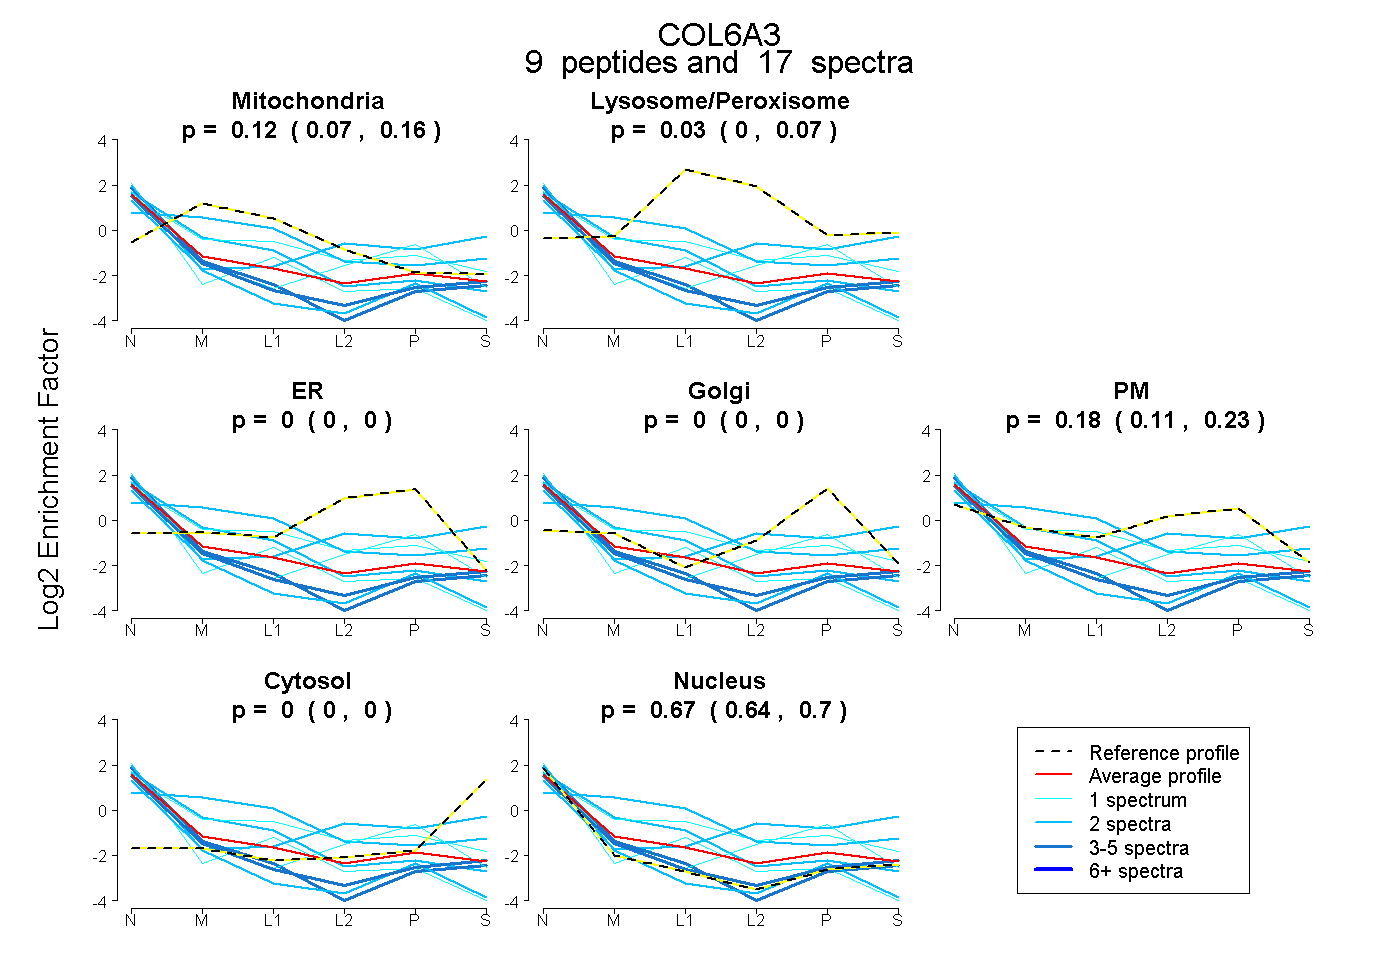
0.073 | 0.158
0.000 | 0.072
0.000 | 0.000
0.000 | 0.000
0.113 | 0.225
0.000 | 0.000
0.638 | 0.700
29peptides
spectra
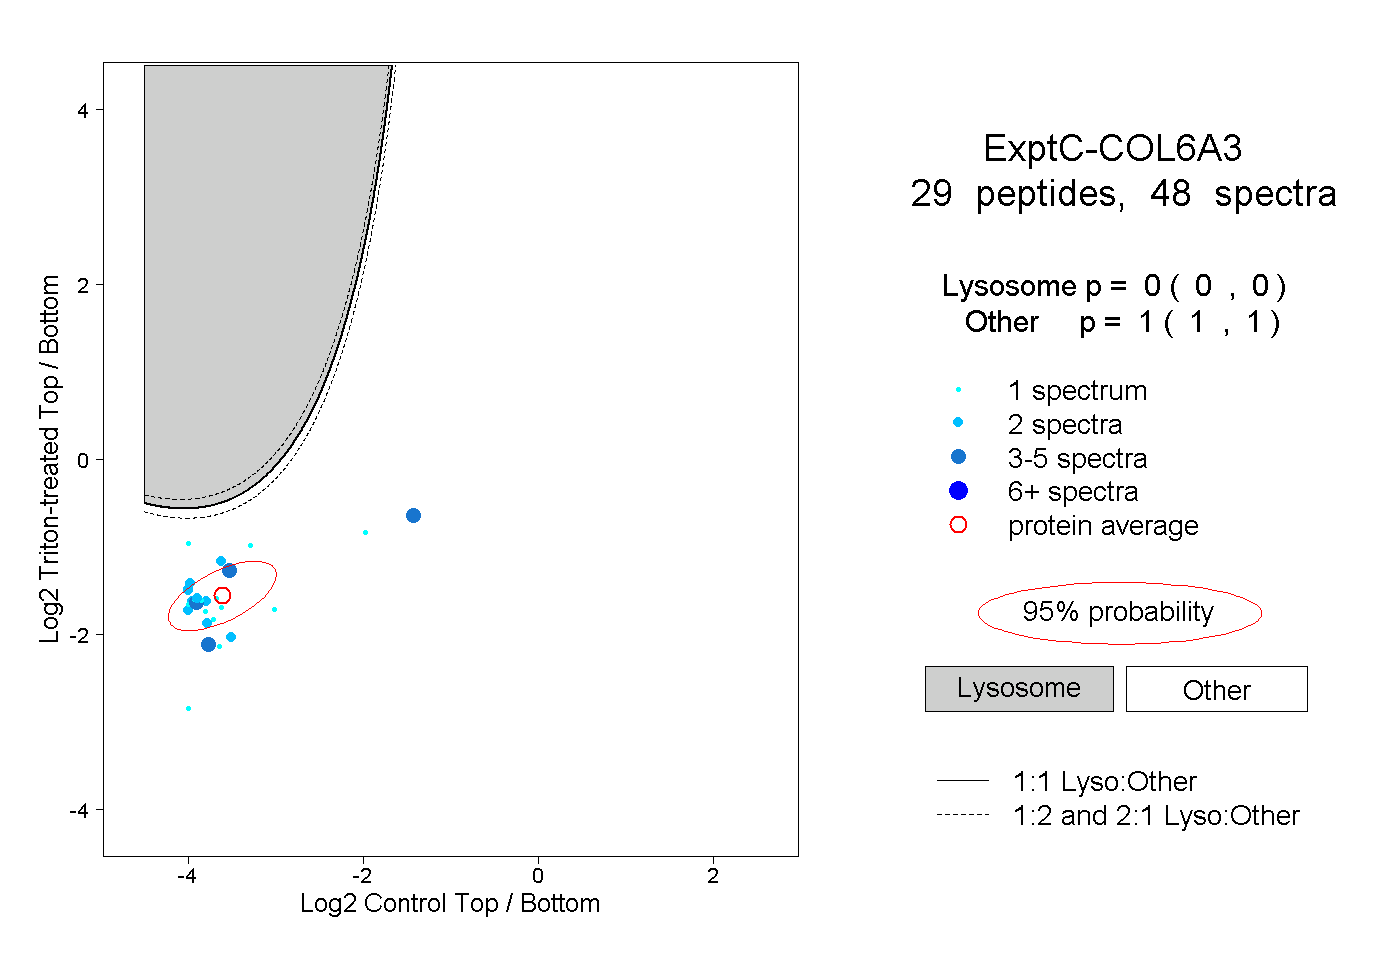
0.000 | 0.000
1.000 | 1.000
3peptides
spectra
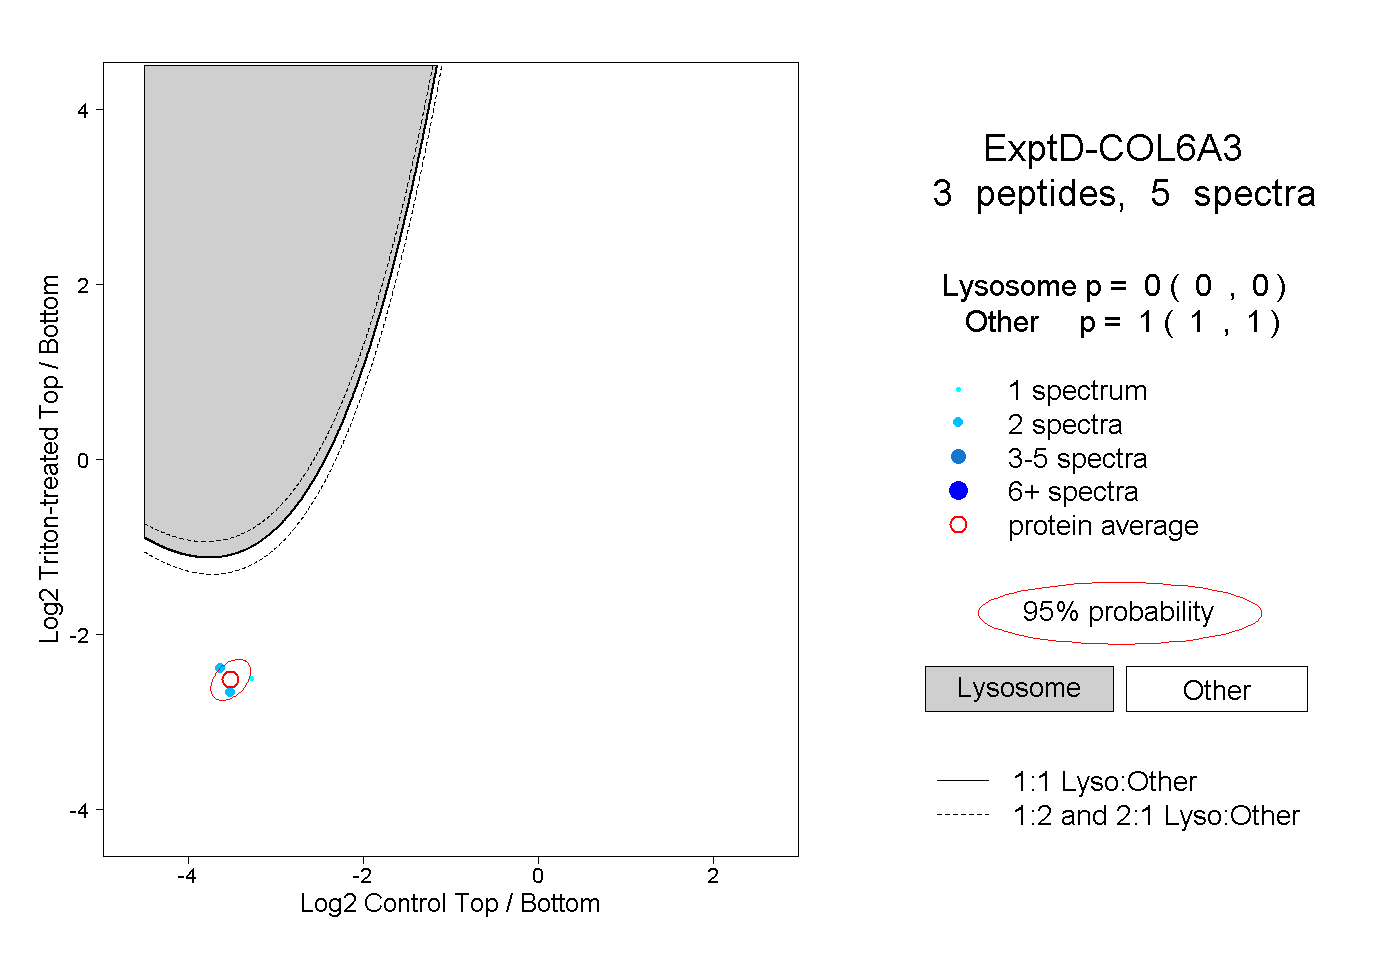
0.000 | 0.000
1.000 | 1.000