 8
8peptides
spectra
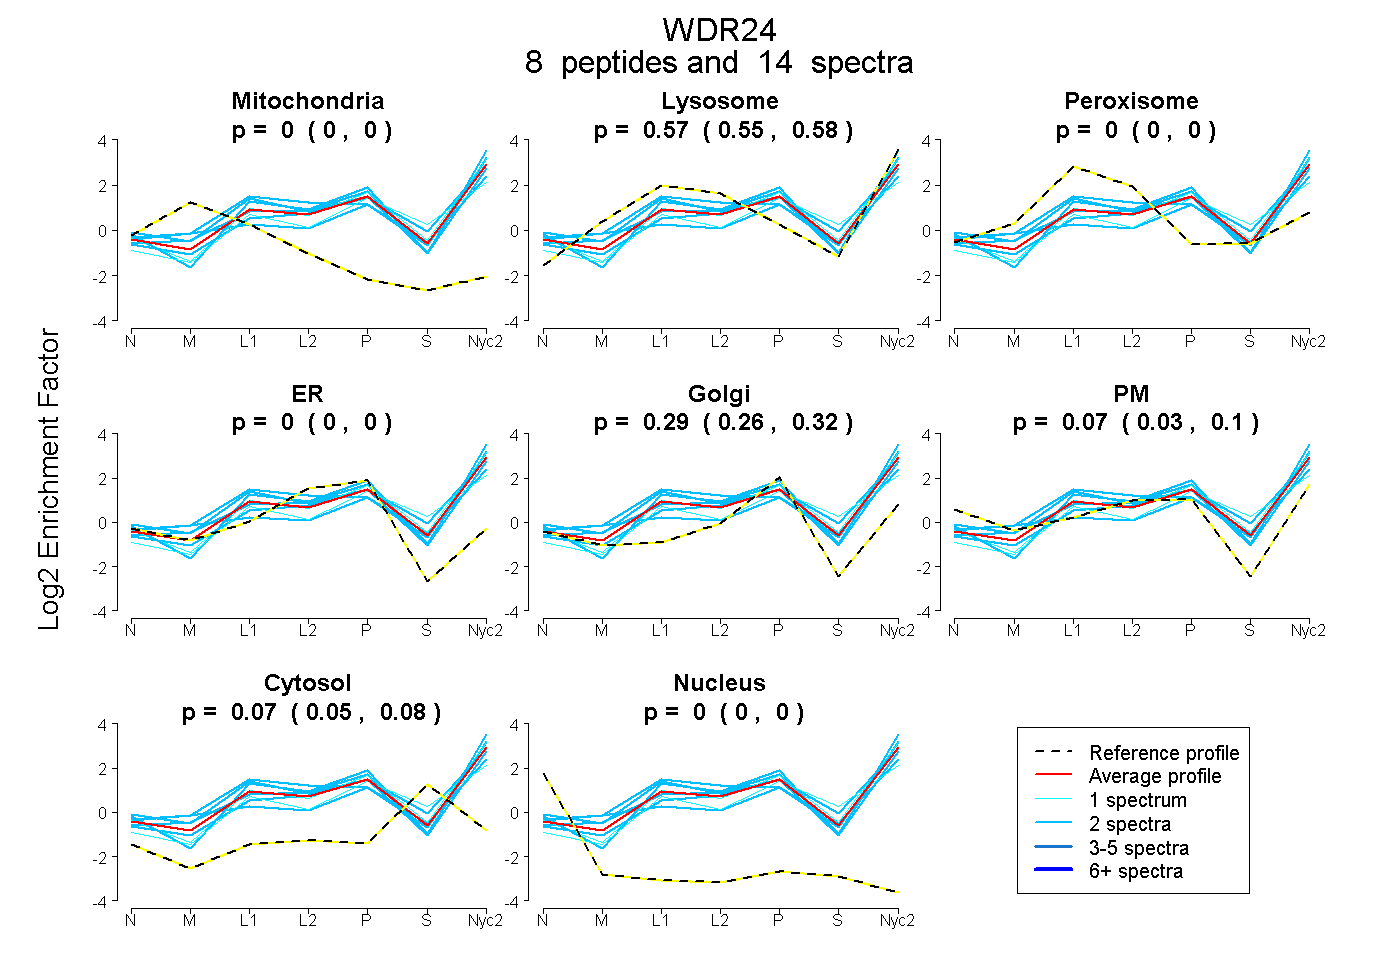
0.000 | 0.000
0.548 | 0.585
0.000 | 0.000
0.000 | 0.000
0.262 | 0.319
0.034 | 0.098
0.055 | 0.080
0.000 | 0.000
5peptides
spectra
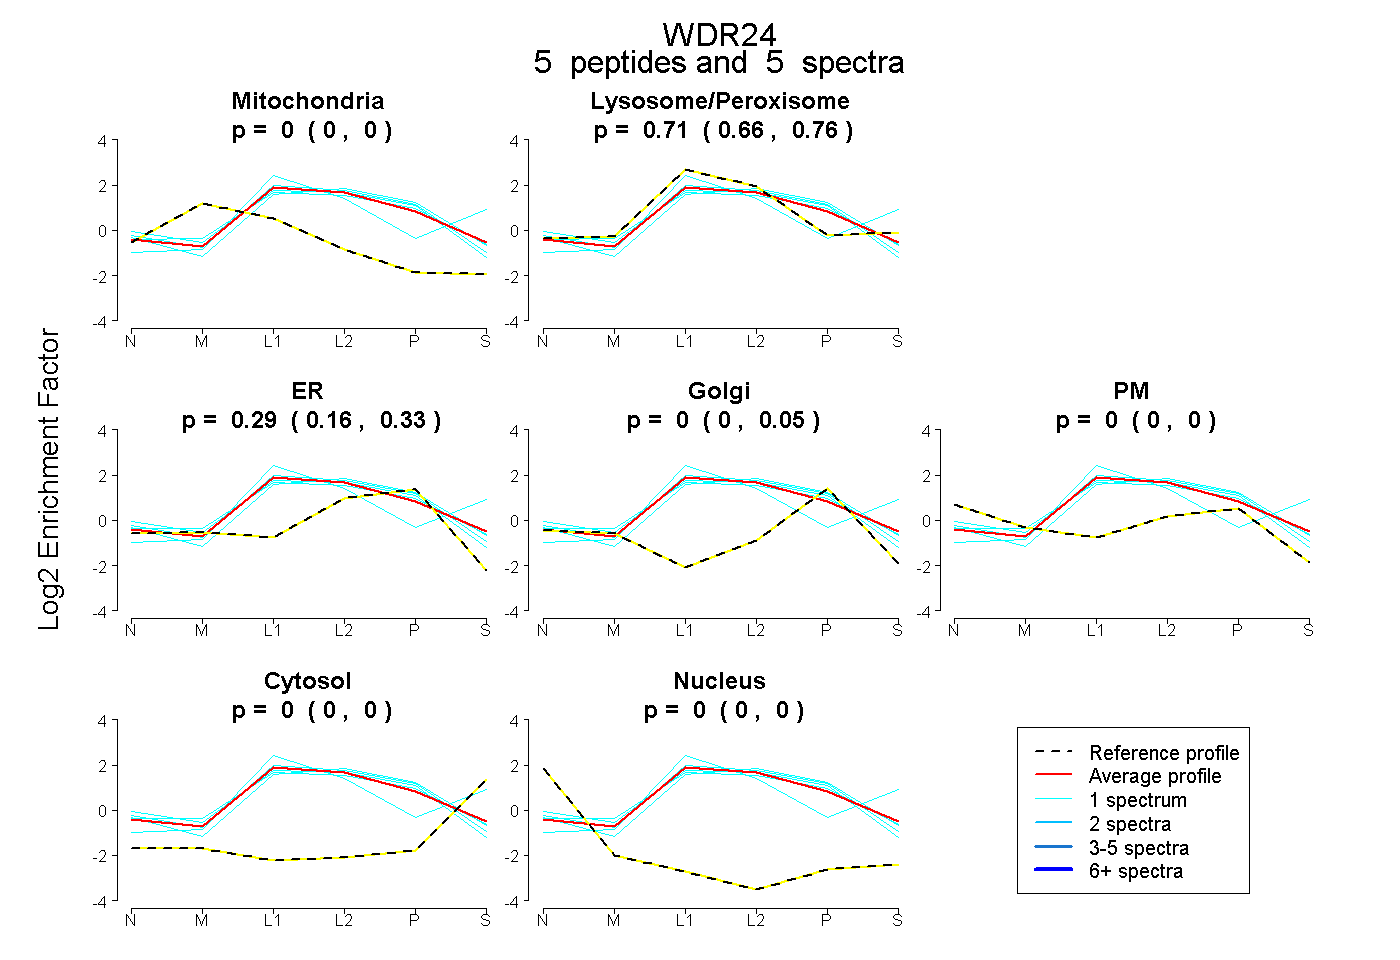
0.000 | 0.000
0.663 | 0.763
0.164 | 0.328
0.000 | 0.050
0.000 | 0.000
0.000 | 0.000
0.000 | 0.000
11peptides
spectra
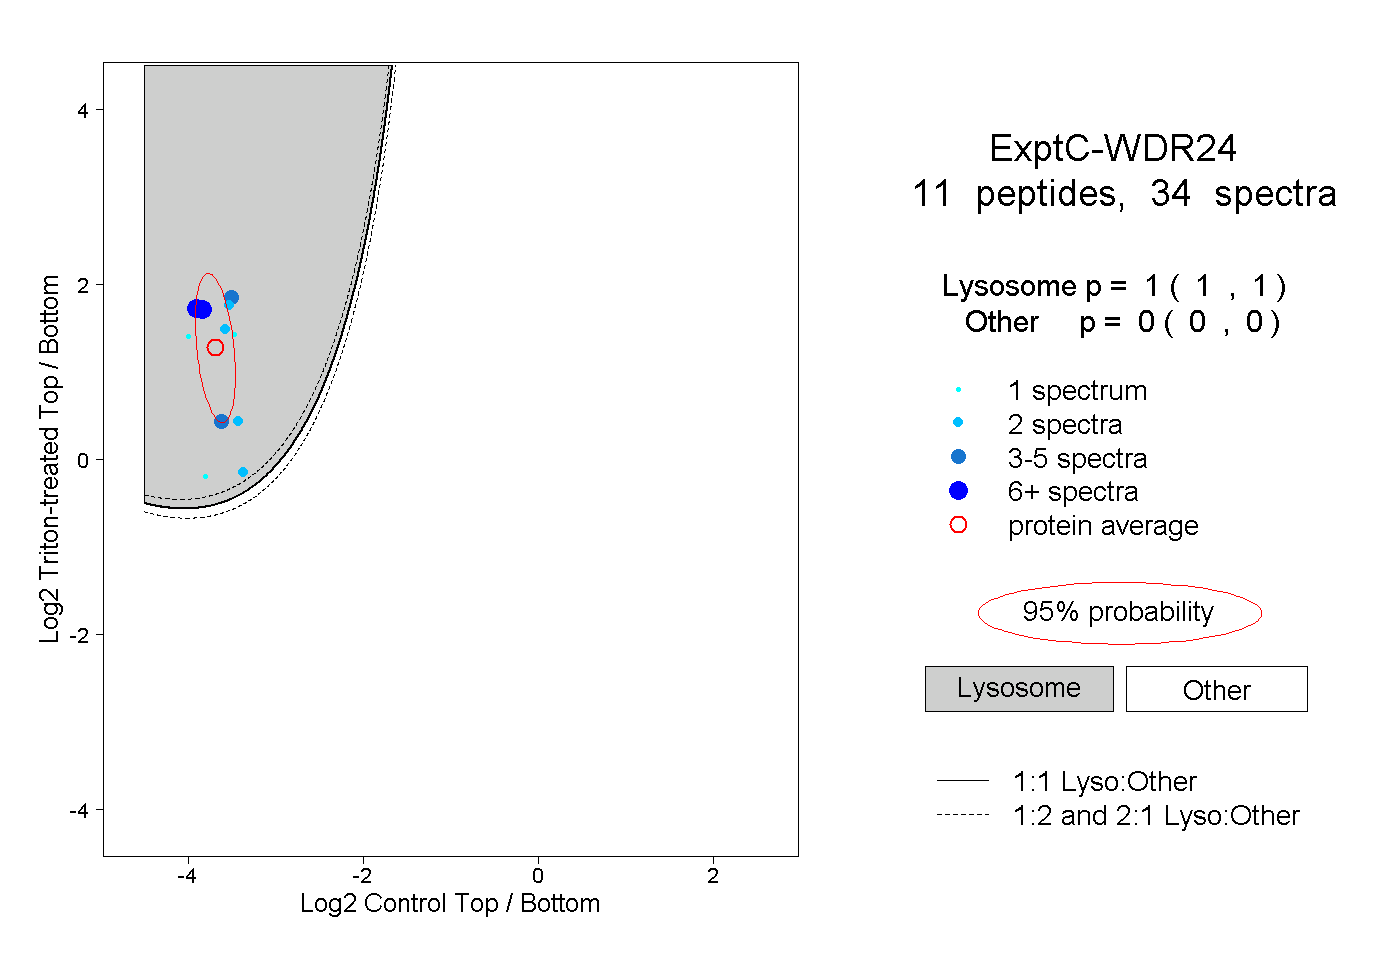
1.000 | 1.000
0.000 | 0.000
2peptides
spectra
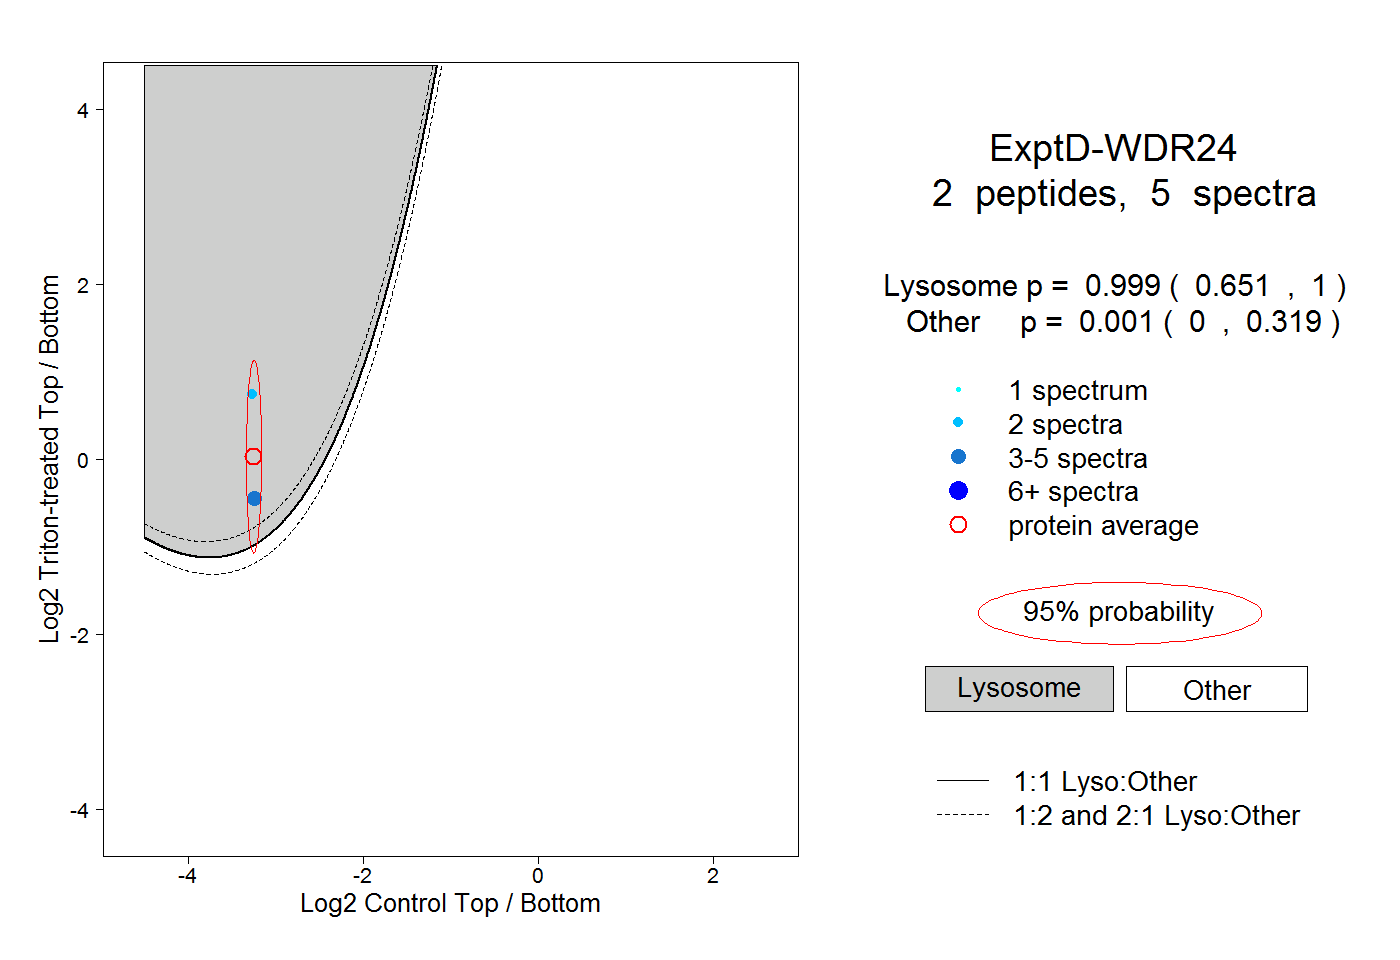
0.651 | 1.000
0.000 | 0.319