 8
8peptides
spectra
0.000 | 0.000
0.548 | 0.585
0.000 | 0.000
0.000 | 0.000
0.262 | 0.319
0.034 | 0.098
0.055 | 0.080
0.000 | 0.000
| Plot | Mito | Lyso | Perox | ER | Golgi | PM | Cytosol | Nucleus | |||||
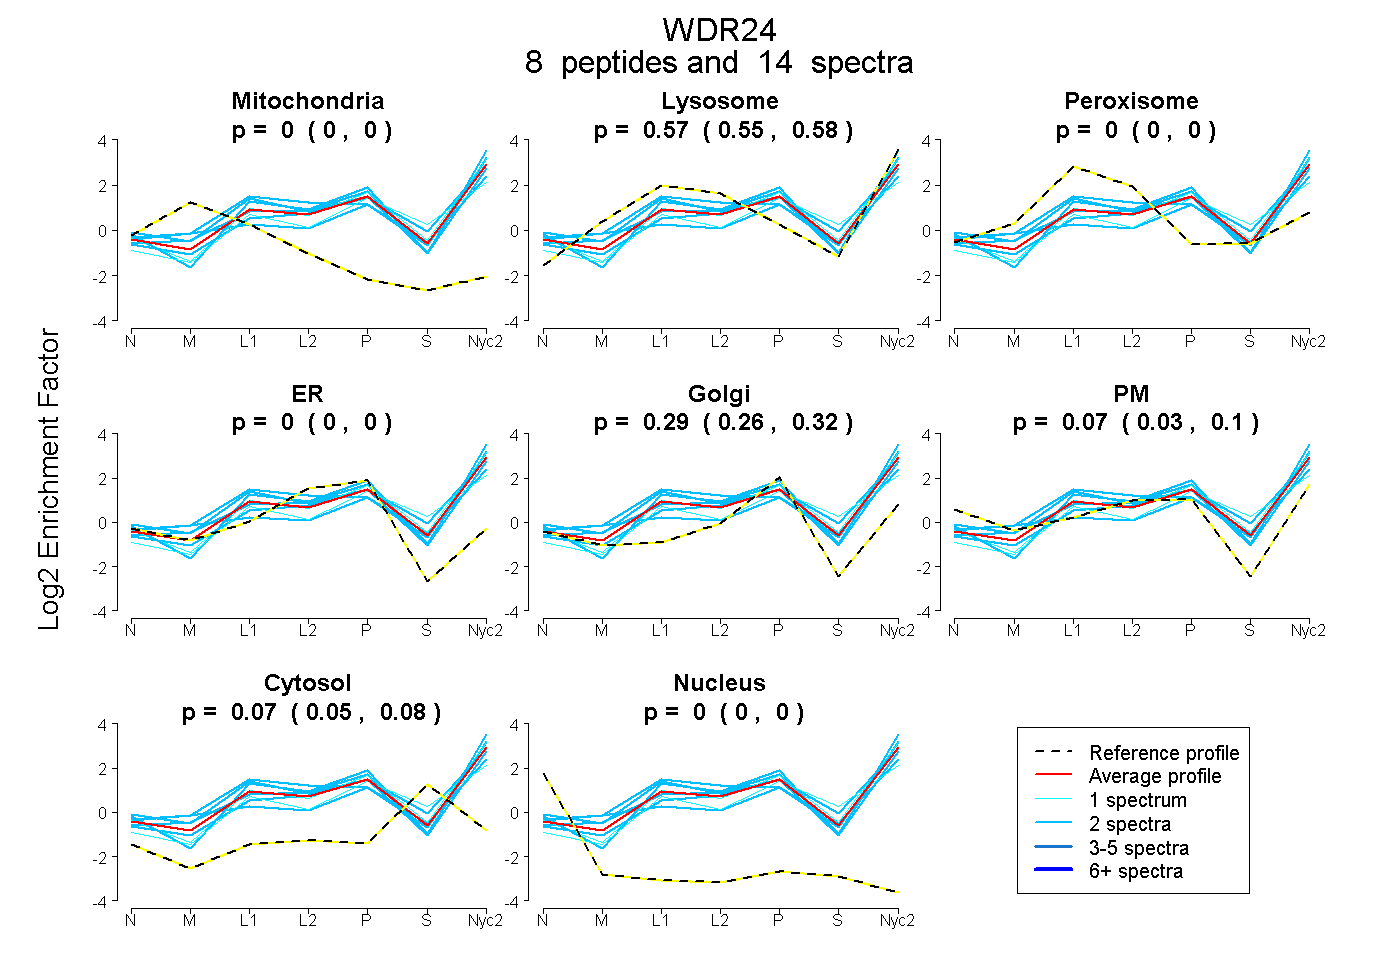
| Expt A |
8 peptides |
14 spectra |
|
0.000 0.000 | 0.000 |
0.569 0.548 | 0.585 |
0.000 0.000 | 0.000 |
0.000 0.000 | 0.000 |
0.293 0.262 | 0.319 |
0.070 0.034 | 0.098 |
0.068 0.055 | 0.080 |
0.000 0.000 | 0.000 |
| 2 spectra, DASQPVER | 0.000 | 0.569 | 0.000 | 0.000 | 0.287 | 0.000 | 0.145 | 0.000 | ||
| 1 spectrum, YALAGRPLAELCDHNAK | 0.000 | 0.473 | 0.000 | 0.000 | 0.252 | 0.000 | 0.274 | 0.000 | ||
| 2 spectra, IYAIEEEQFVEK | 0.000 | 0.448 | 0.000 | 0.000 | 0.300 | 0.106 | 0.146 | 0.000 | ||
| 1 spectrum, LPPDFFSVLVR | 0.000 | 0.579 | 0.000 | 0.000 | 0.352 | 0.000 | 0.068 | 0.000 | ||
| 2 spectra, VTTALSGSALTGR | 0.000 | 0.563 | 0.000 | 0.000 | 0.294 | 0.143 | 0.000 | 0.000 | ||
| 2 spectra, DAAQVVVAGR | 0.000 | 0.659 | 0.000 | 0.000 | 0.000 | 0.317 | 0.025 | 0.000 | ||
| 2 spectra, GWLATGGR | 0.000 | 0.621 | 0.000 | 0.000 | 0.379 | 0.000 | 0.000 | 0.000 | ||
| 2 spectra, ESLVAAESGR | 0.000 | 0.513 | 0.000 | 0.000 | 0.149 | 0.332 | 0.006 | 0.000 |
| Plot | Mito | Lyso or Perox | ER | Golgi | PM | Cytosol | Nucleus | ||||||
| Expt B |
5 peptides |
5 spectra |
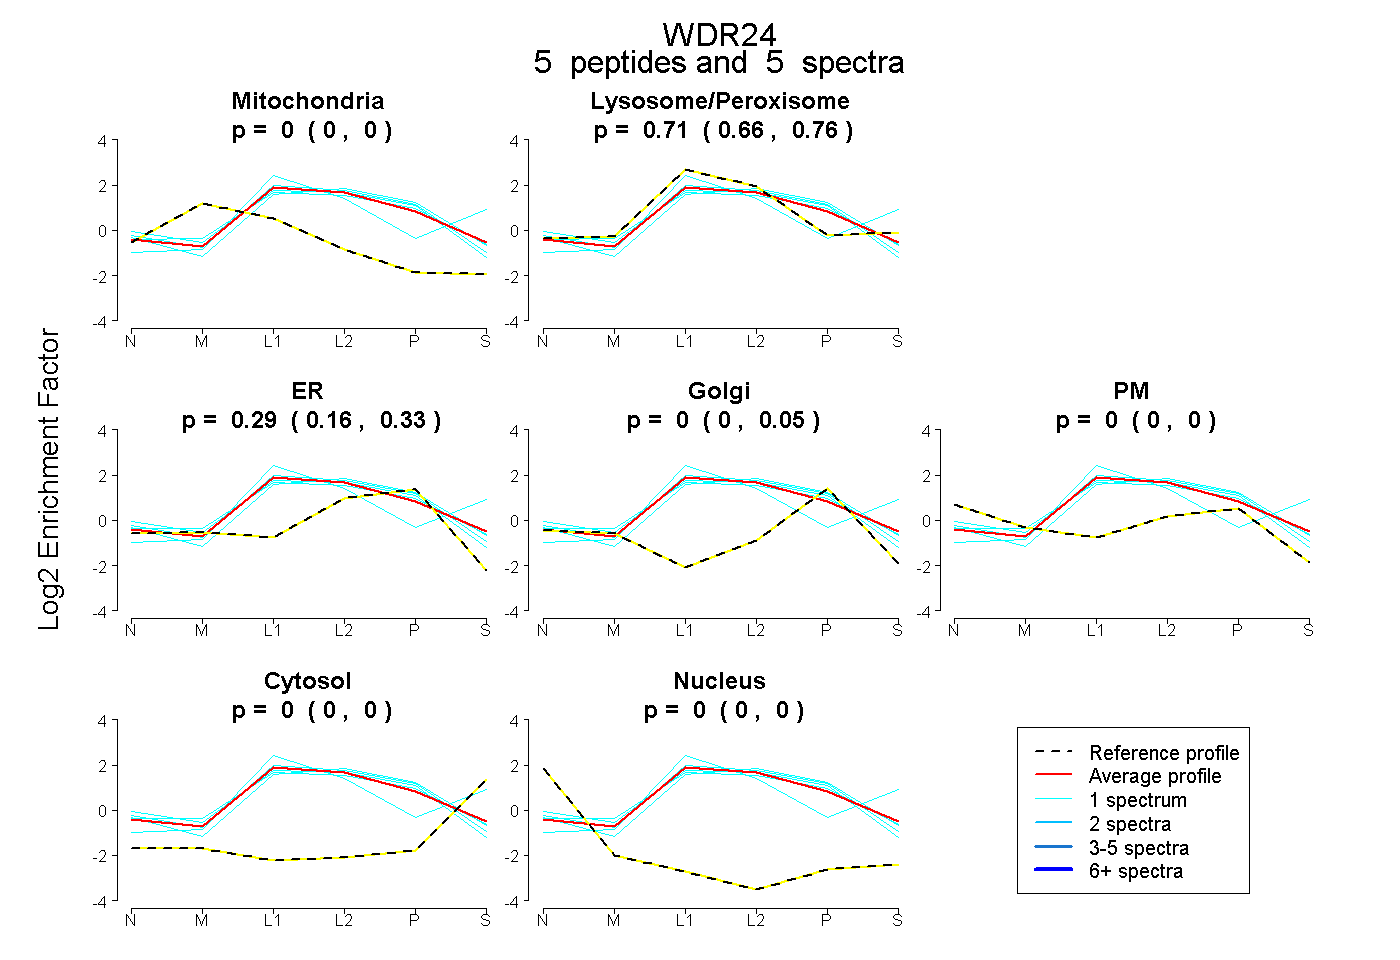 |
0.000 0.000 | 0.000 |
0.712 0.663 | 0.763 |
0.288 0.164 | 0.328 |
0.000 0.000 | 0.050 |
0.000 0.000 | 0.000 |
0.000 0.000 | 0.000 |
0.000 0.000 | 0.000 |
|||
| Plot | Lyso | Other | |||||||||||
| Expt C |
11 peptides |
34 spectra |
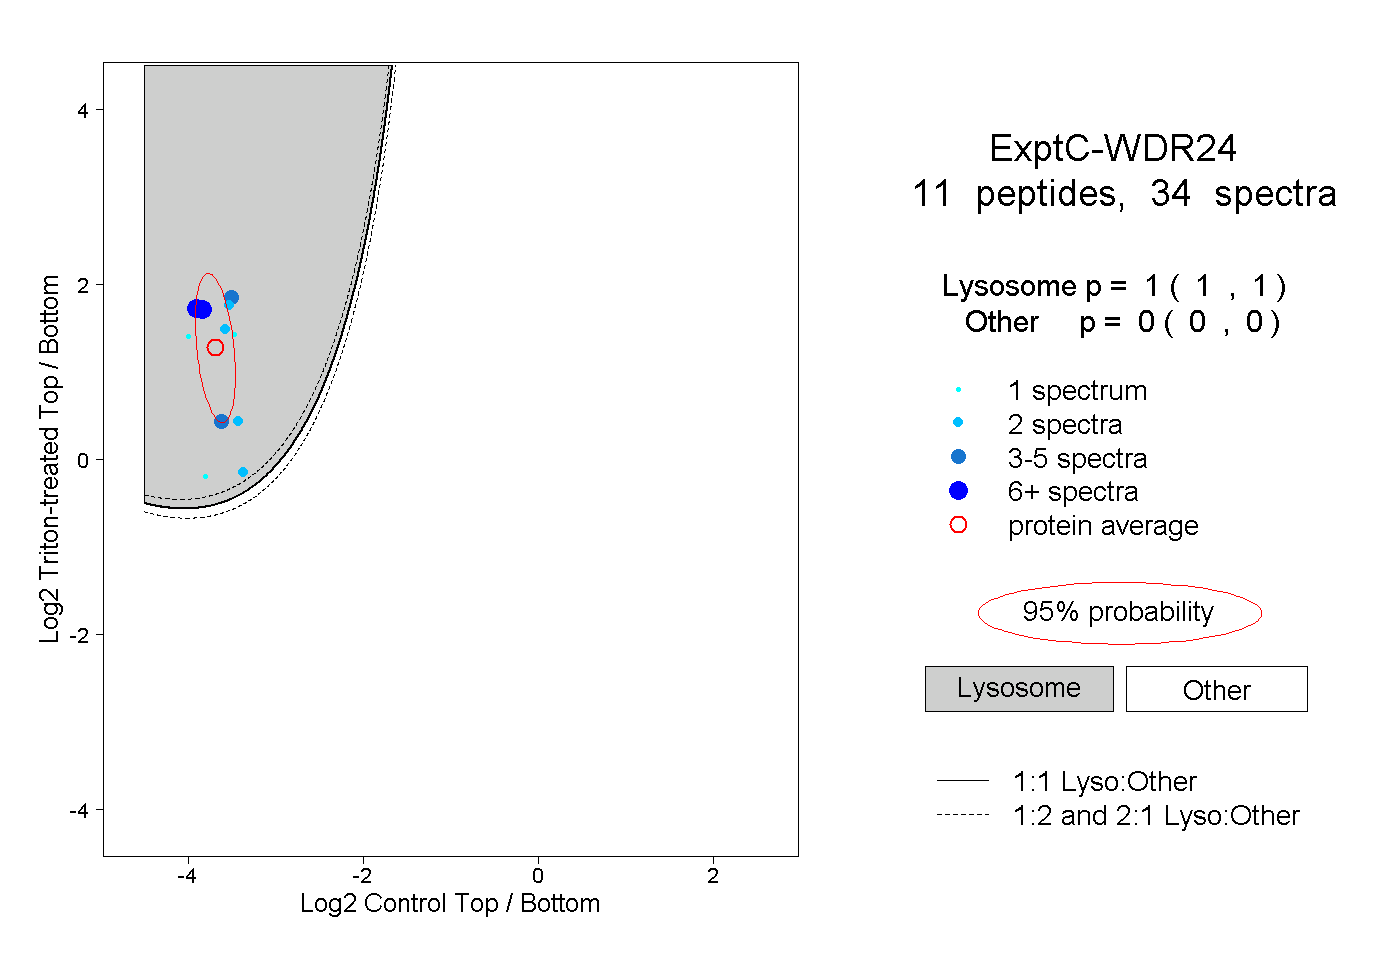 |
1.000 1.000 | 1.000 |
0.000 0.000 | 0.000 |
||||||||
| Plot | Lyso | Other | |||||||||||
| Expt D |
2 peptides |
5 spectra |
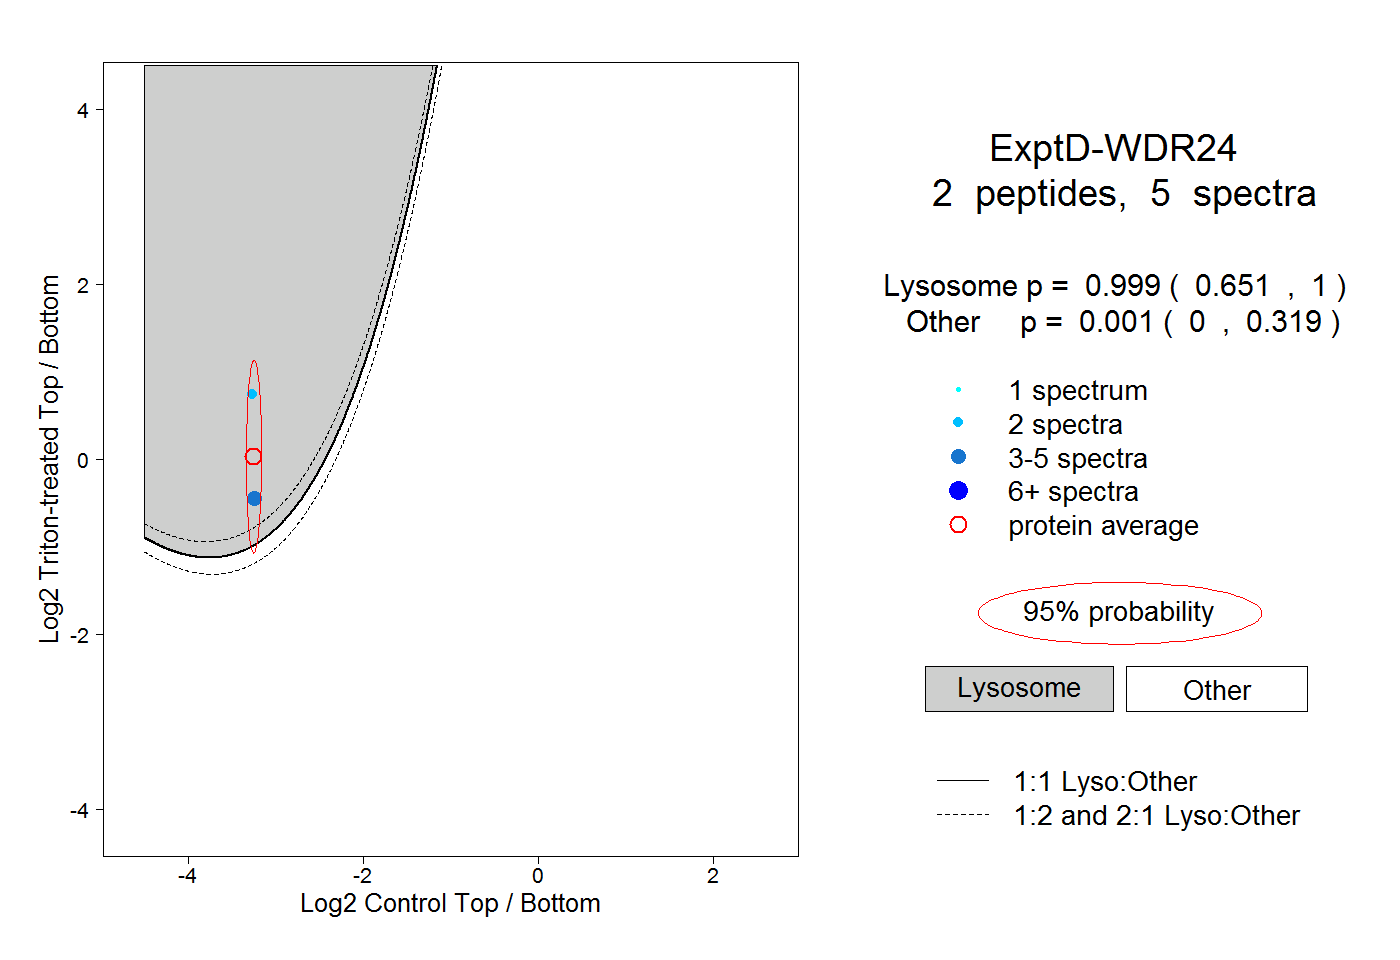 |
0.999 0.651 | 1.000 |
0.001 0.000 | 0.319 |