 8
8peptides
spectra
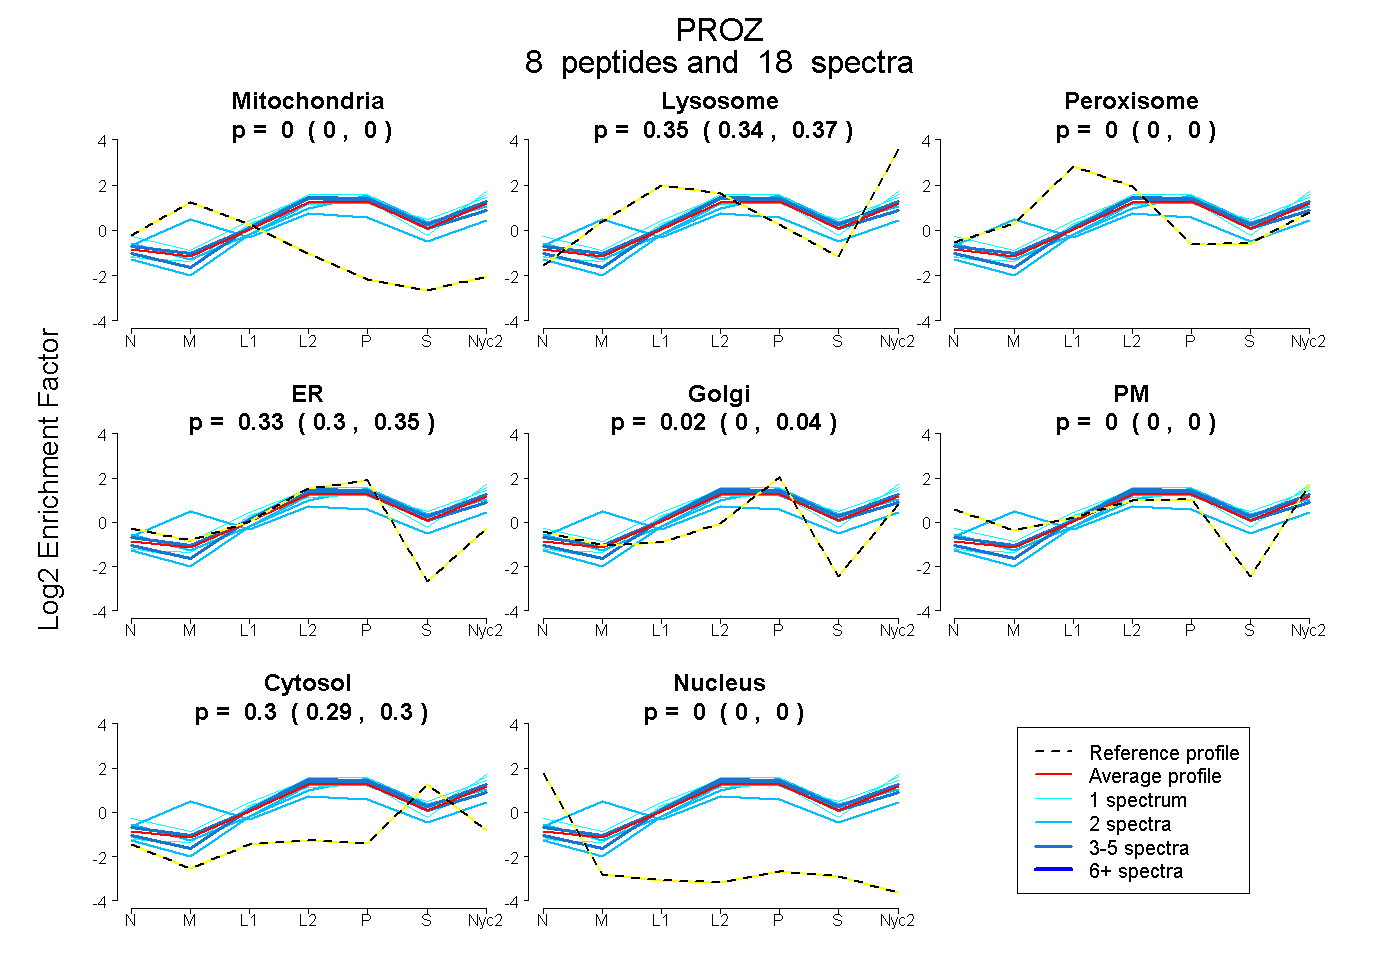
0.000 | 0.000
0.341 | 0.365
0.000 | 0.000
0.302 | 0.350
0.000 | 0.043
0.000 | 0.000
0.286 | 0.305
0.000 | 0.000
1peptide
spectrum
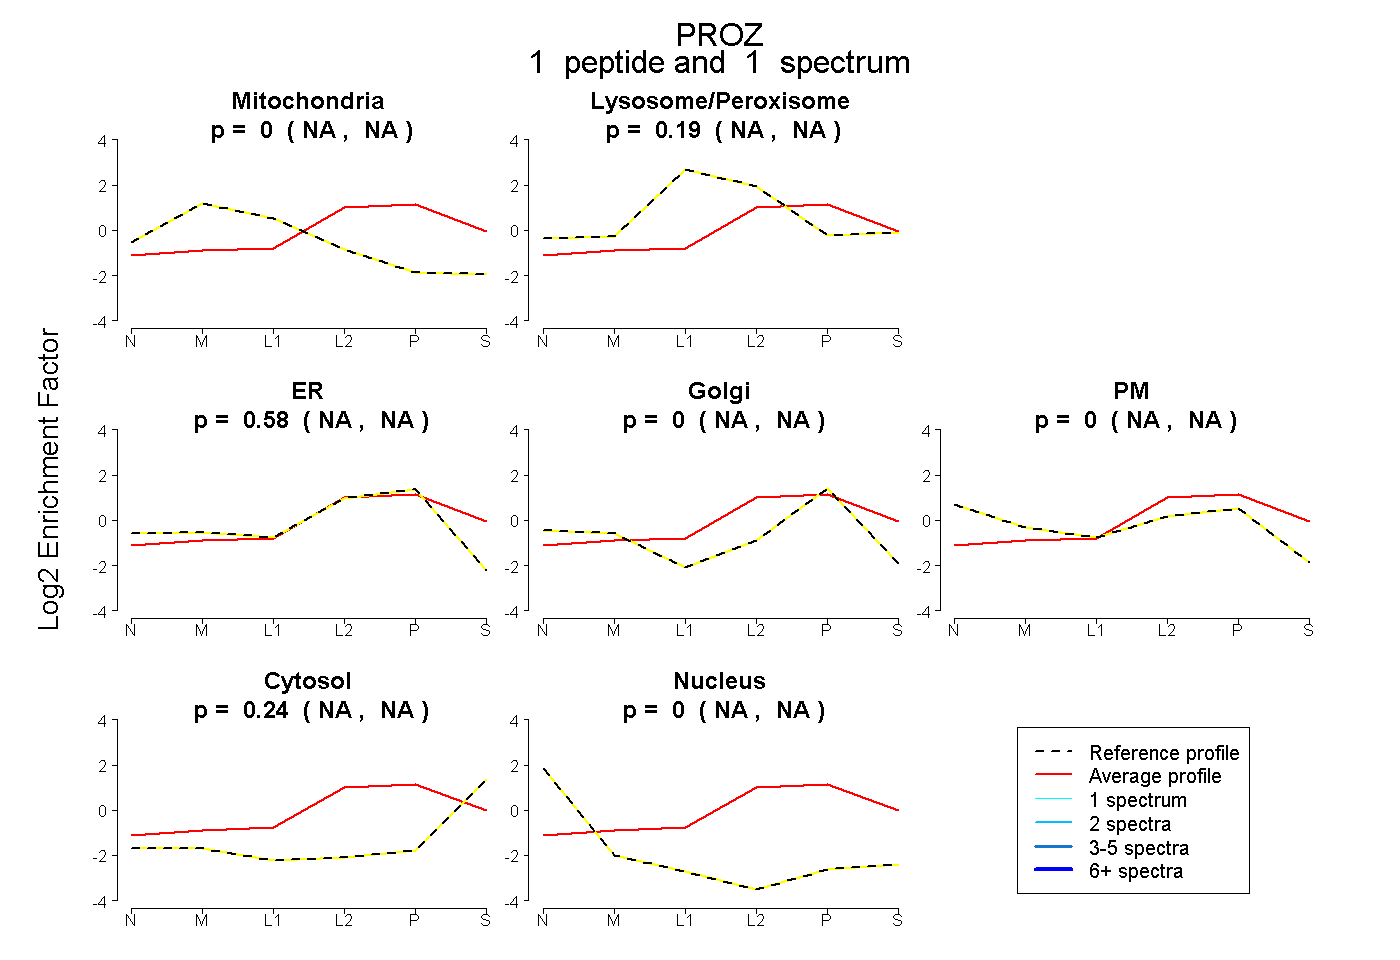
NA | NA
NA | NA
NA | NA
NA | NA
NA | NA
NA | NA
NA | NA
8peptides
spectra
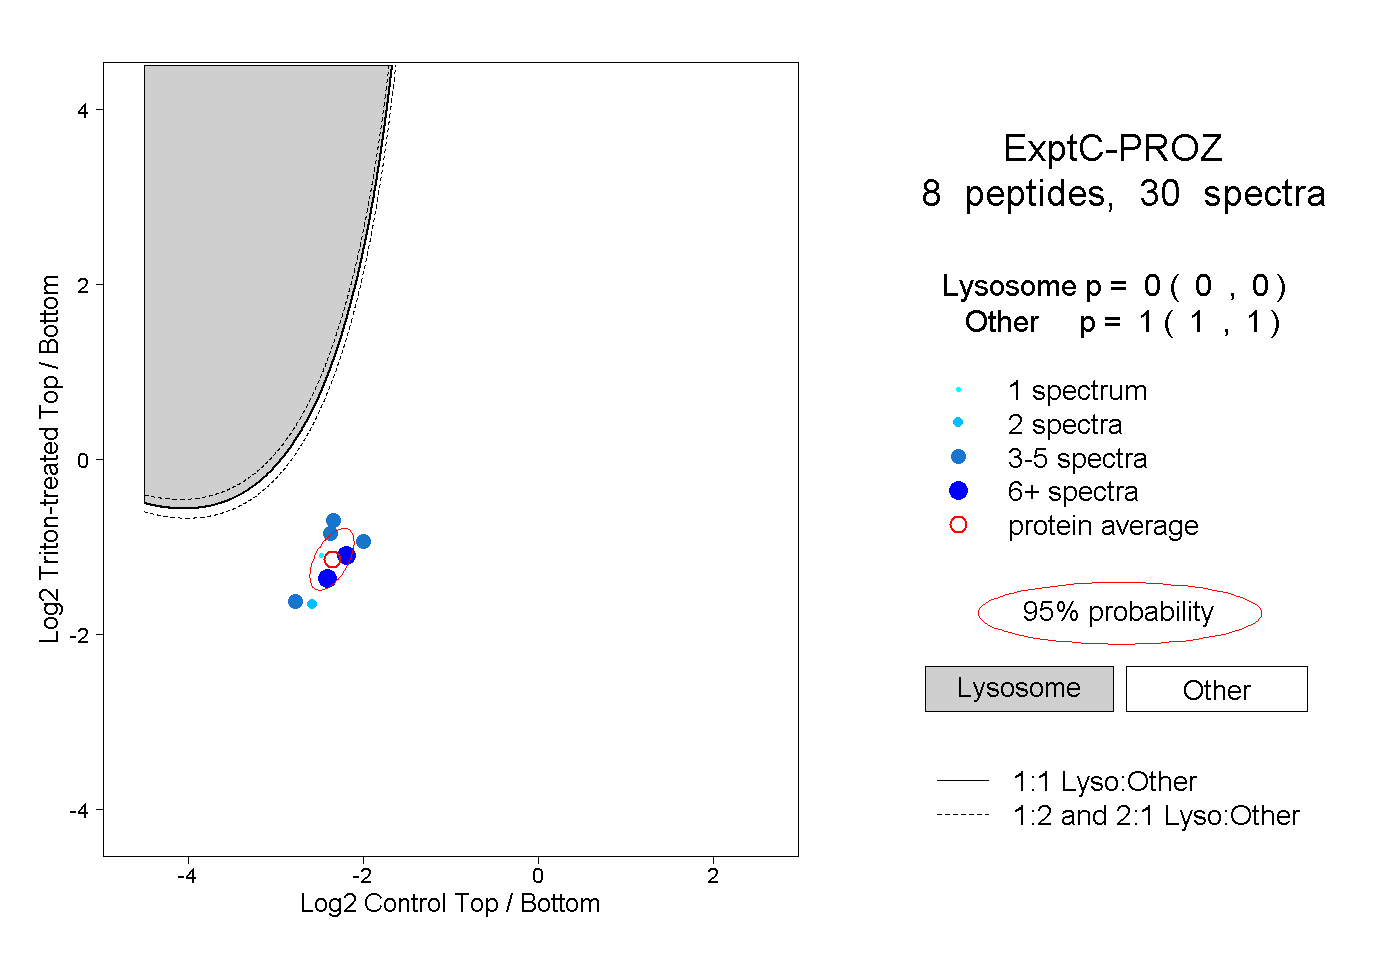
0.000 | 0.000
1.000 | 1.000
1peptide
spectra
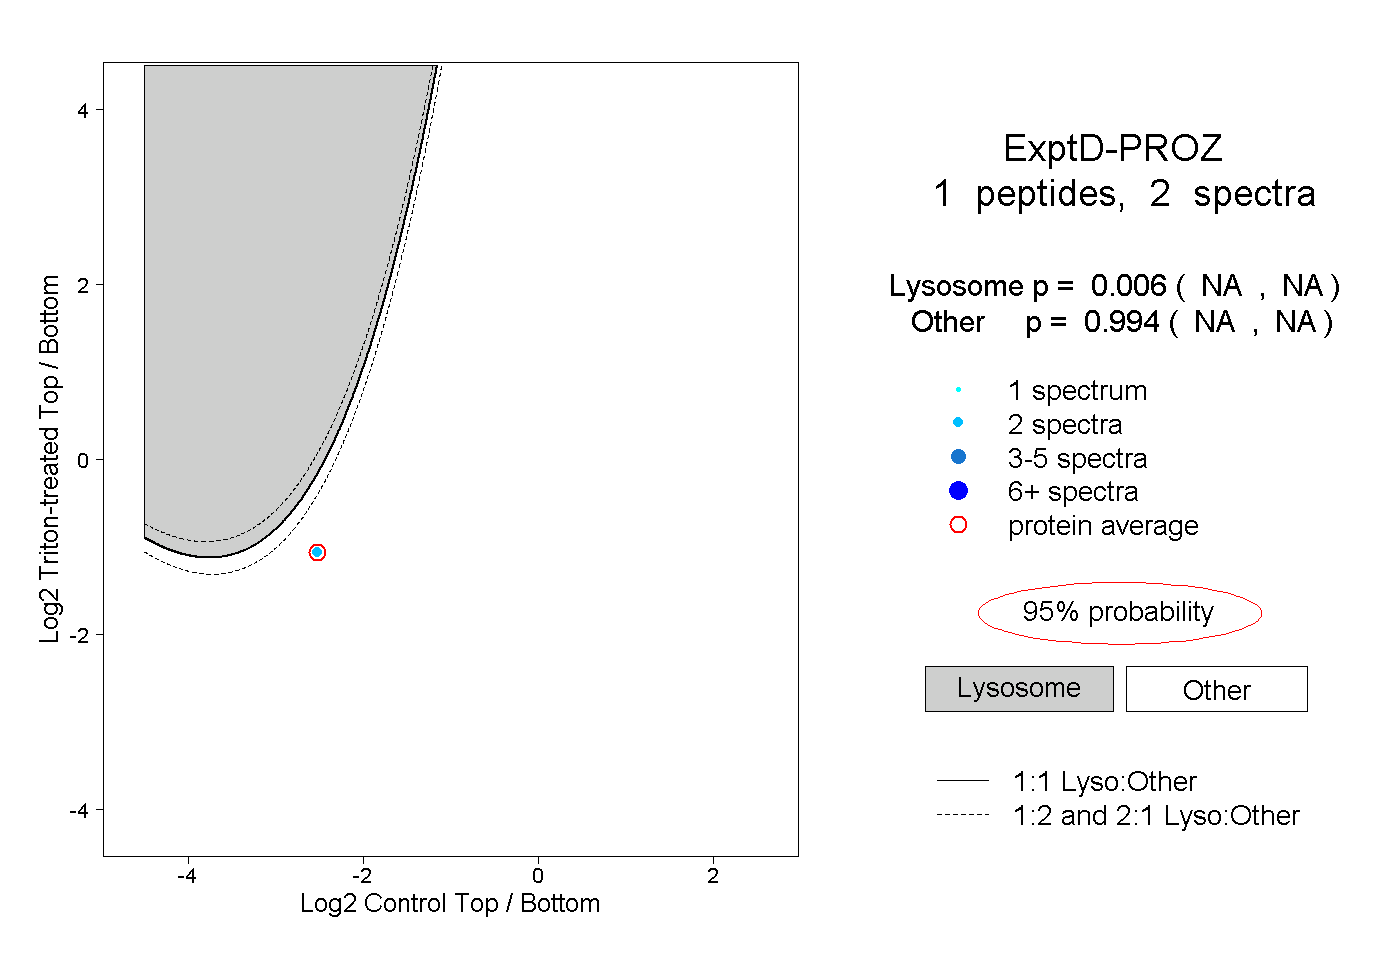
NA | NA
NA | NA