 8
8peptides
spectra
0.000 | 0.000
0.341 | 0.365
0.000 | 0.000
0.302 | 0.350
0.000 | 0.043
0.000 | 0.000
0.286 | 0.305
0.000 | 0.000
| Plot | Mito | Lyso | Perox | ER | Golgi | PM | Cytosol | Nucleus | |||||
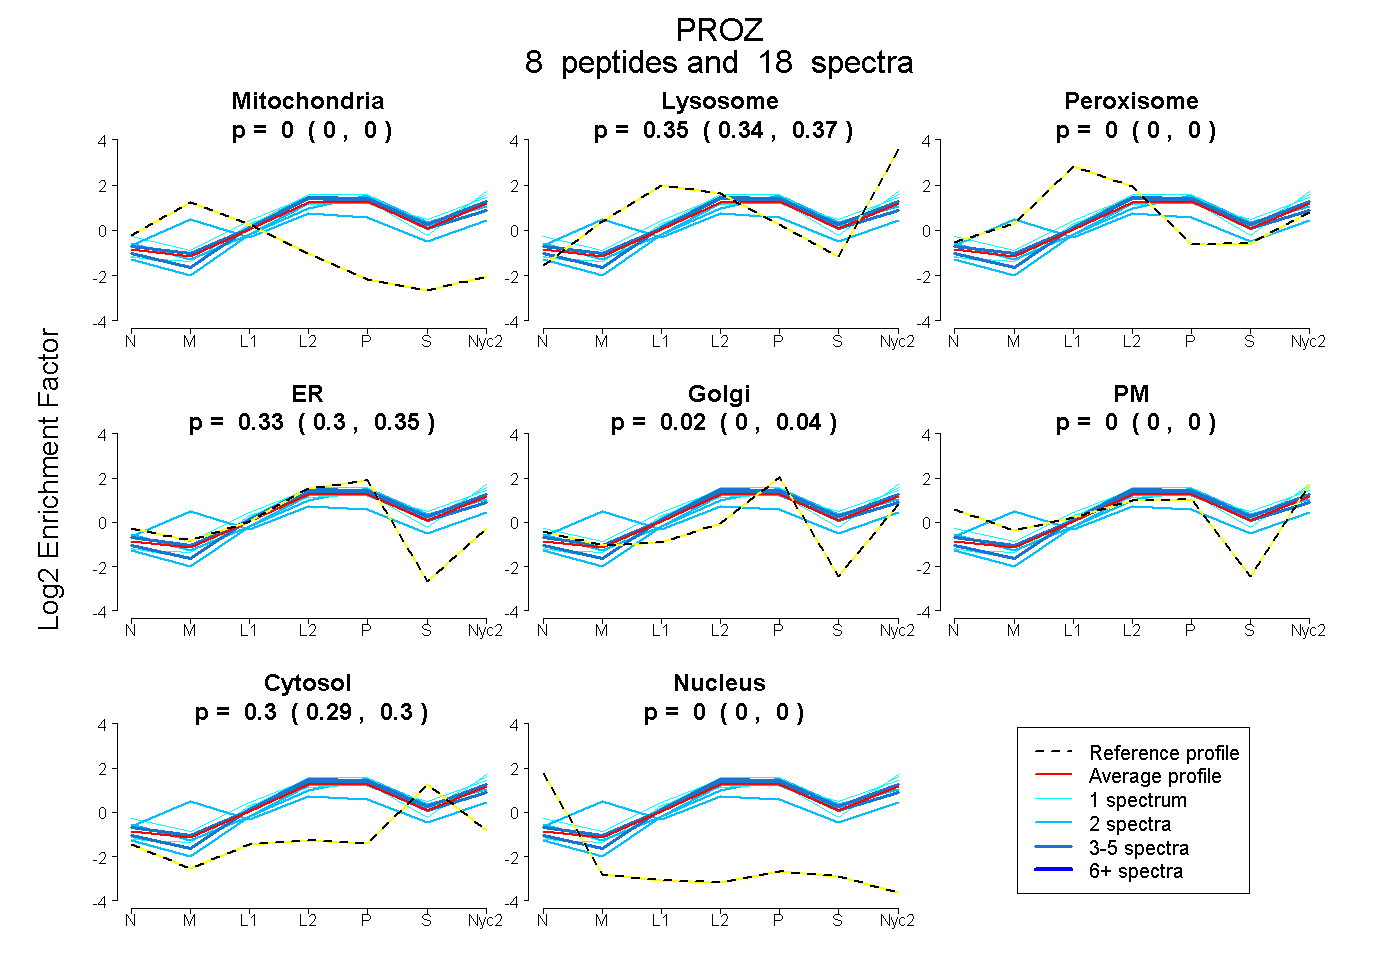
| Expt A |
8 peptides |
18 spectra |
|
0.000 0.000 | 0.000 |
0.355 0.341 | 0.365 |
0.000 0.000 | 0.000 |
0.329 0.302 | 0.350 |
0.020 0.000 | 0.043 |
0.000 0.000 | 0.000 |
0.296 0.286 | 0.305 |
0.000 0.000 | 0.000 |
| 2 spectra, LGEDHR | 0.000 | 0.320 | 0.000 | 0.274 | 0.082 | 0.010 | 0.314 | 0.000 | ||
| 5 spectra, TQMTDDICR | 0.000 | 0.314 | 0.000 | 0.406 | 0.000 | 0.000 | 0.280 | 0.000 | ||
| 1 spectrum, GSEVMGPWVEGSVVTR | 0.000 | 0.420 | 0.000 | 0.210 | 0.023 | 0.000 | 0.347 | 0.000 | ||
| 1 spectrum, GVLSGWMLNGIDLDR | 0.000 | 0.430 | 0.000 | 0.290 | 0.031 | 0.000 | 0.249 | 0.000 | ||
| 2 spectra, SCSPSDK | 0.111 | 0.209 | 0.118 | 0.166 | 0.198 | 0.000 | 0.198 | 0.000 | ||
| 2 spectra, ADDDQQIR | 0.000 | 0.271 | 0.000 | 0.223 | 0.139 | 0.000 | 0.366 | 0.000 | ||
| 4 spectra, SWPSFPWQVR | 0.000 | 0.364 | 0.000 | 0.329 | 0.000 | 0.000 | 0.307 | 0.000 | ||
| 1 spectrum, DFAEHVLIPGTK | 0.000 | 0.391 | 0.000 | 0.239 | 0.000 | 0.187 | 0.183 | 0.000 |
| Plot | Mito | Lyso or Perox | ER | Golgi | PM | Cytosol | Nucleus | ||||||
| Expt B |
1 peptide |
1 spectrum |
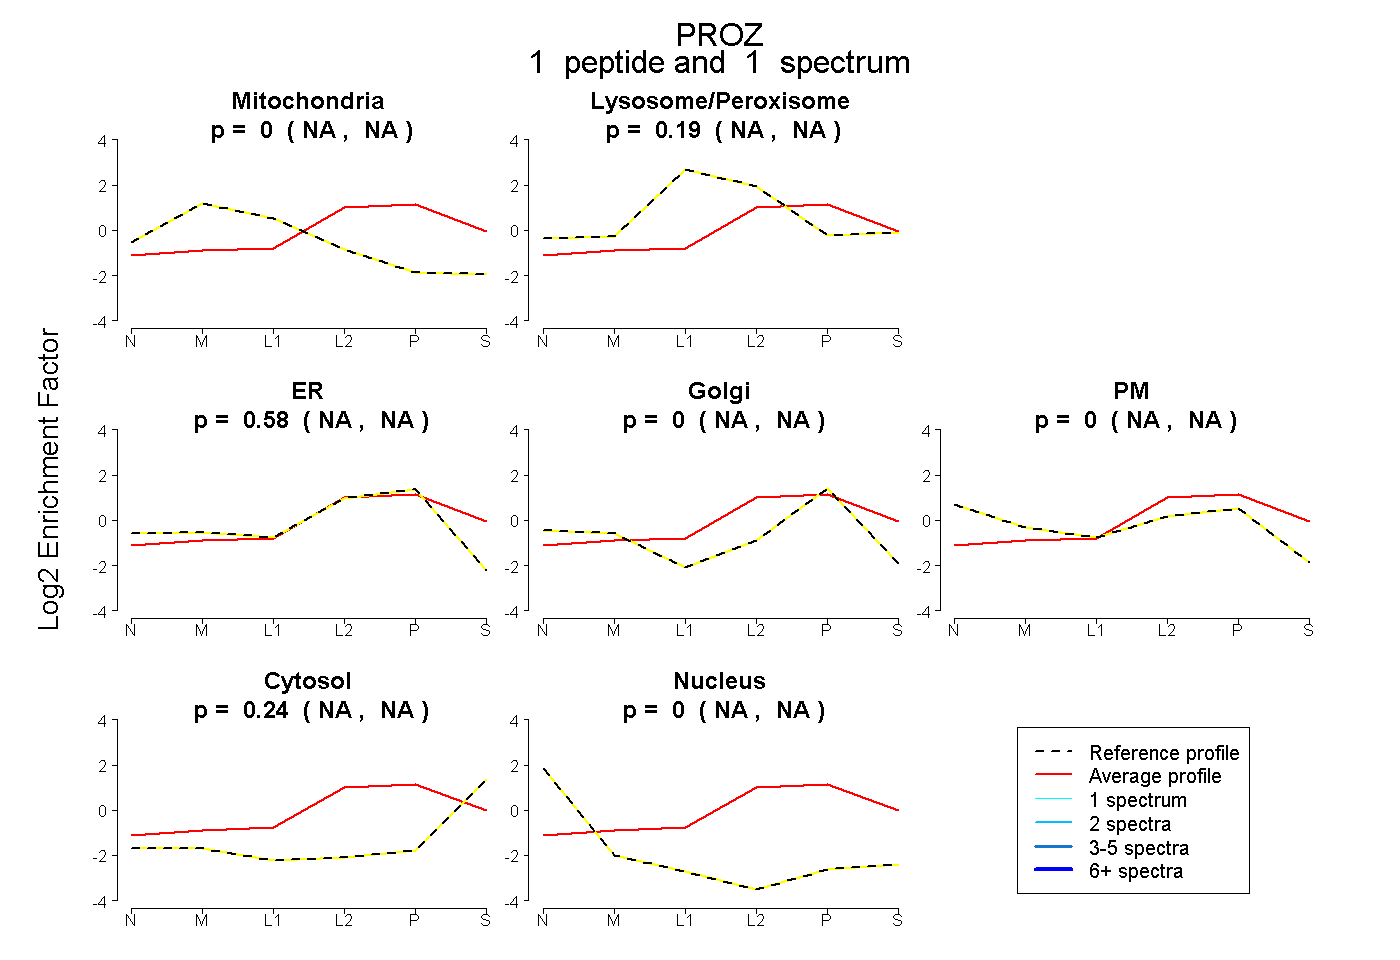 |
0.000 NA | NA |
0.187 NA | NA |
0.575 NA | NA |
0.000 NA | NA |
0.000 NA | NA |
0.238 NA | NA |
0.000 NA | NA |
|||
| Plot | Lyso | Other | |||||||||||
| Expt C |
8 peptides |
30 spectra |
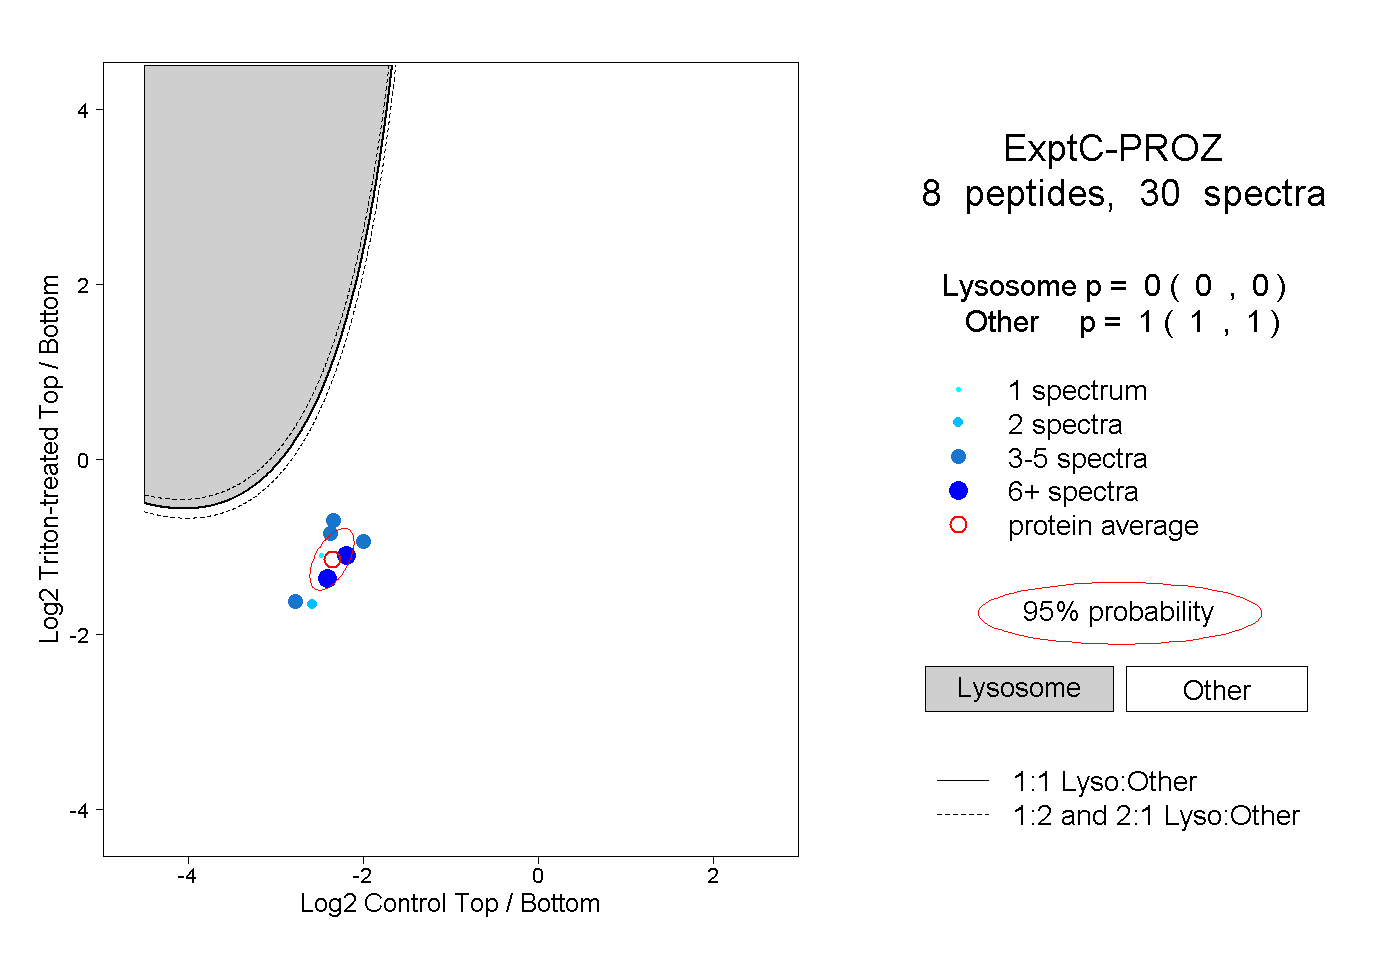 |
0.000 0.000 | 0.000 |
1.000 1.000 | 1.000 |
||||||||
| Plot | Lyso | Other | |||||||||||
| Expt D |
1 peptide |
2 spectra |
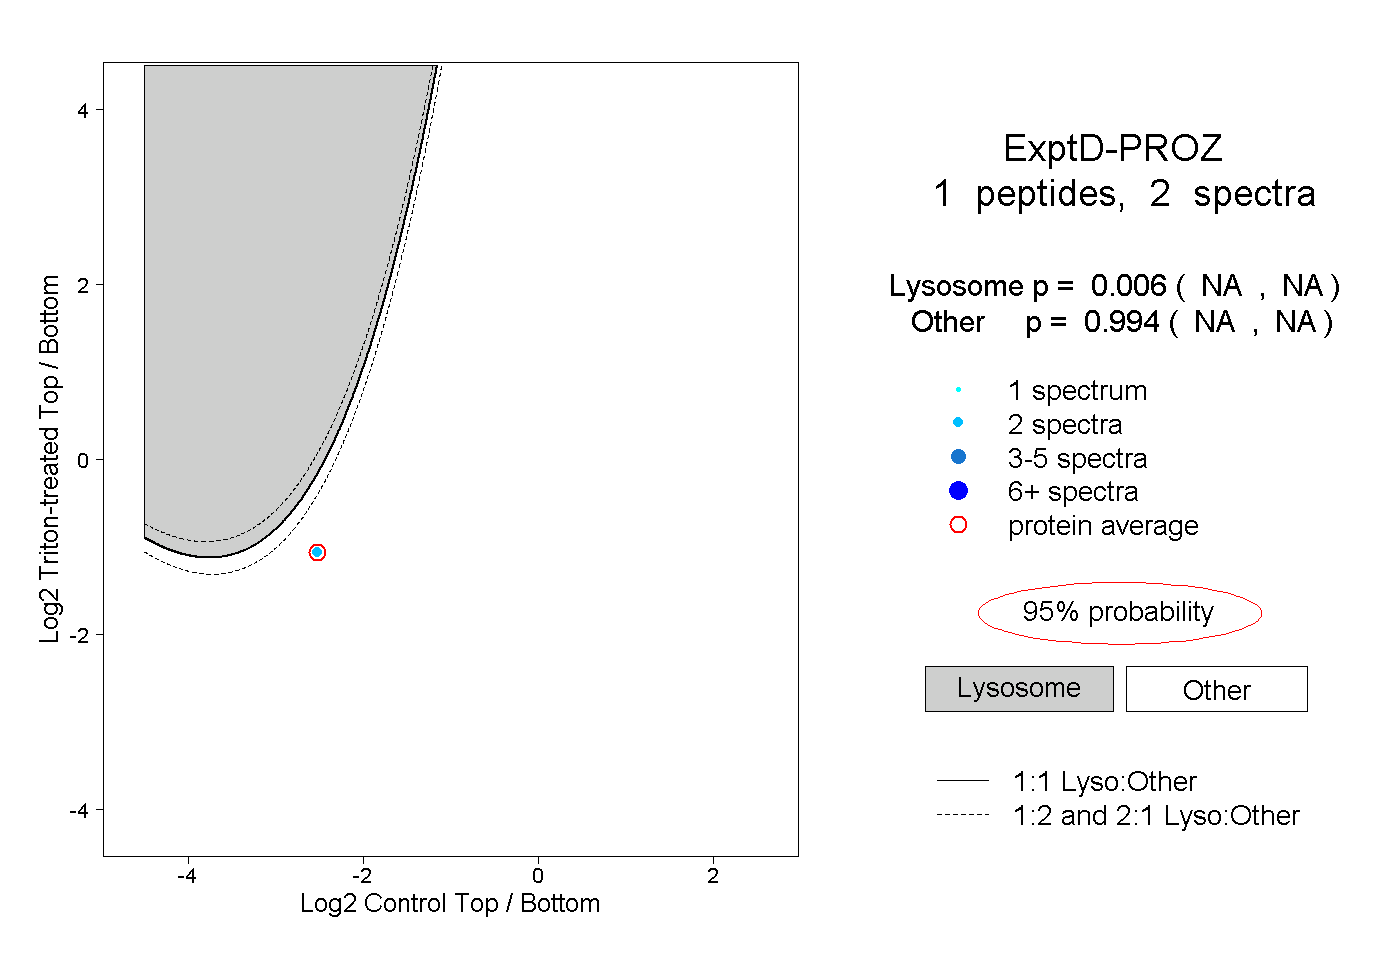 |
0.006 NA | NA |
0.994 NA | NA |