 7
7peptides
spectra
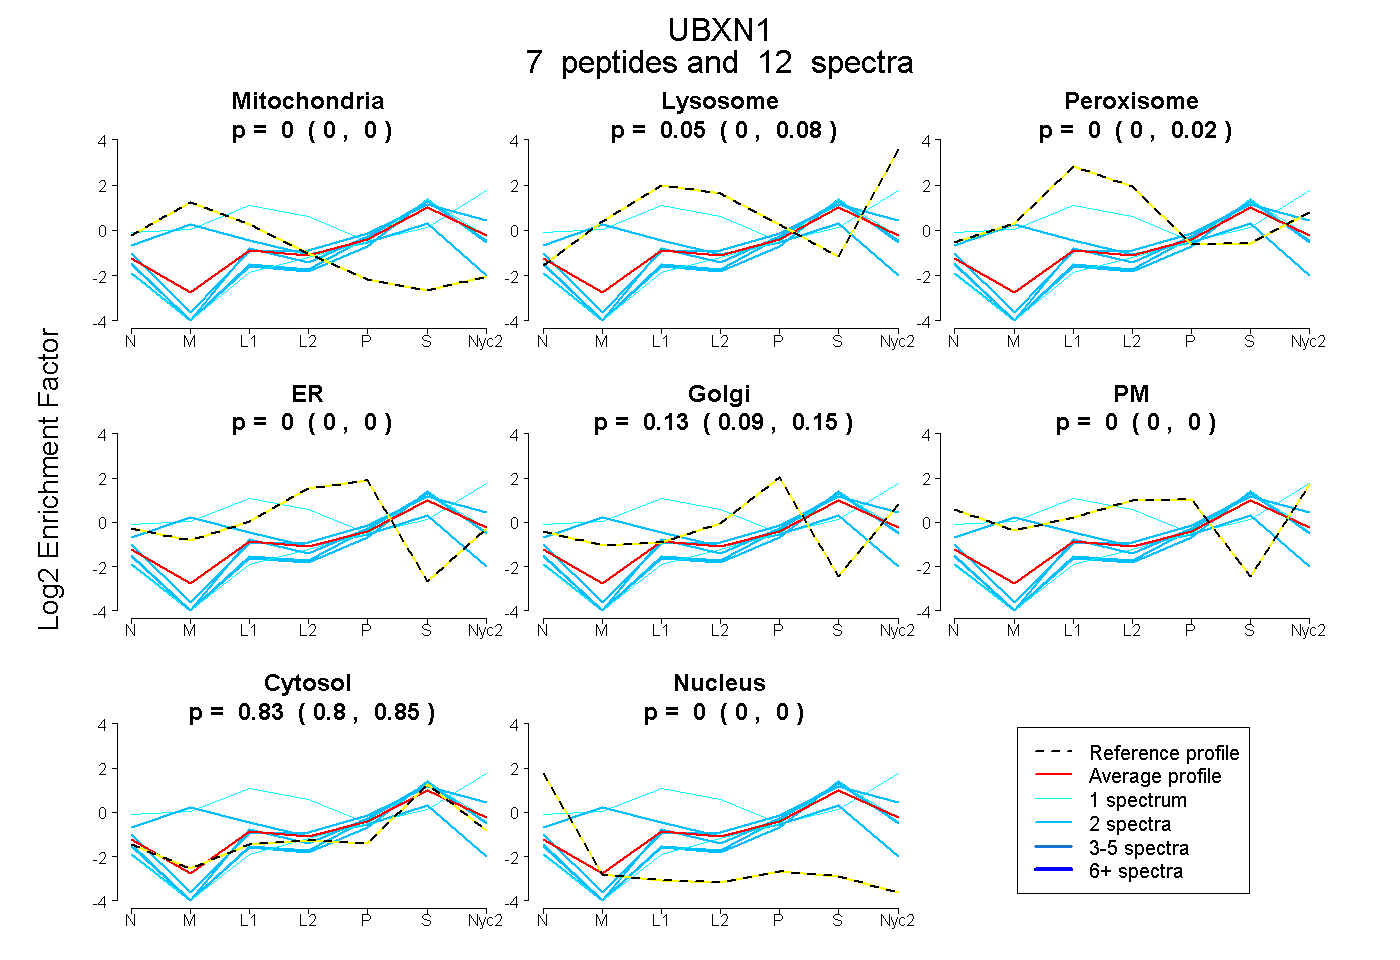
0.000 | 0.000
0.000 | 0.081
0.000 | 0.018
0.000 | 0.000
0.094 | 0.151
0.000 | 0.000
0.796 | 0.850
0.000 | 0.000
3peptides
spectra
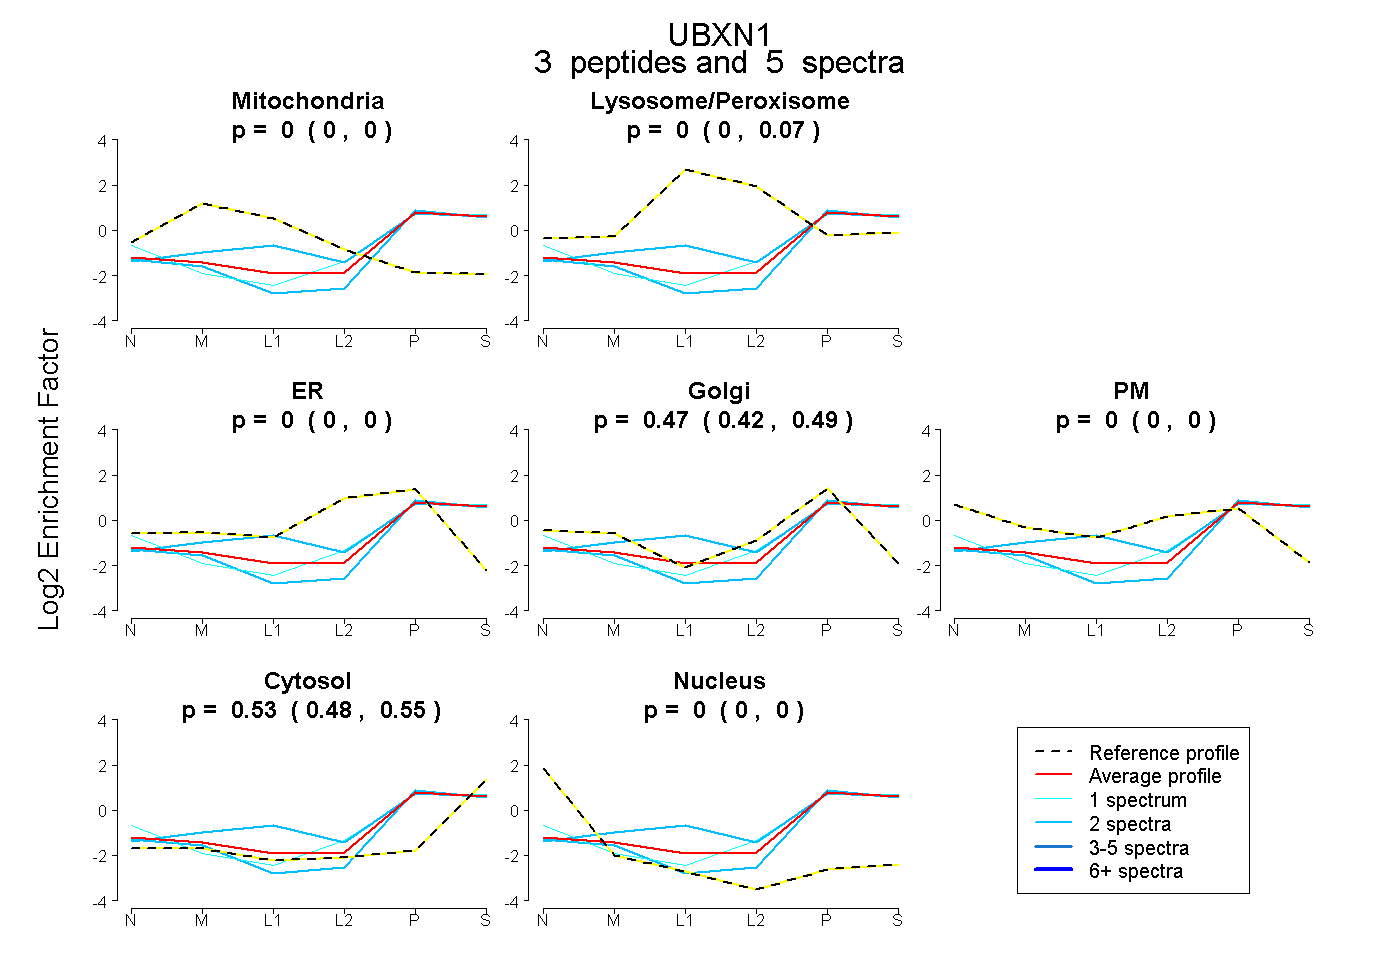
0.000 | 0.000
0.000 | 0.071
0.000 | 0.000
0.416 | 0.489
0.000 | 0.000
0.477 | 0.548
0.000 | 0.000
5peptides
spectra
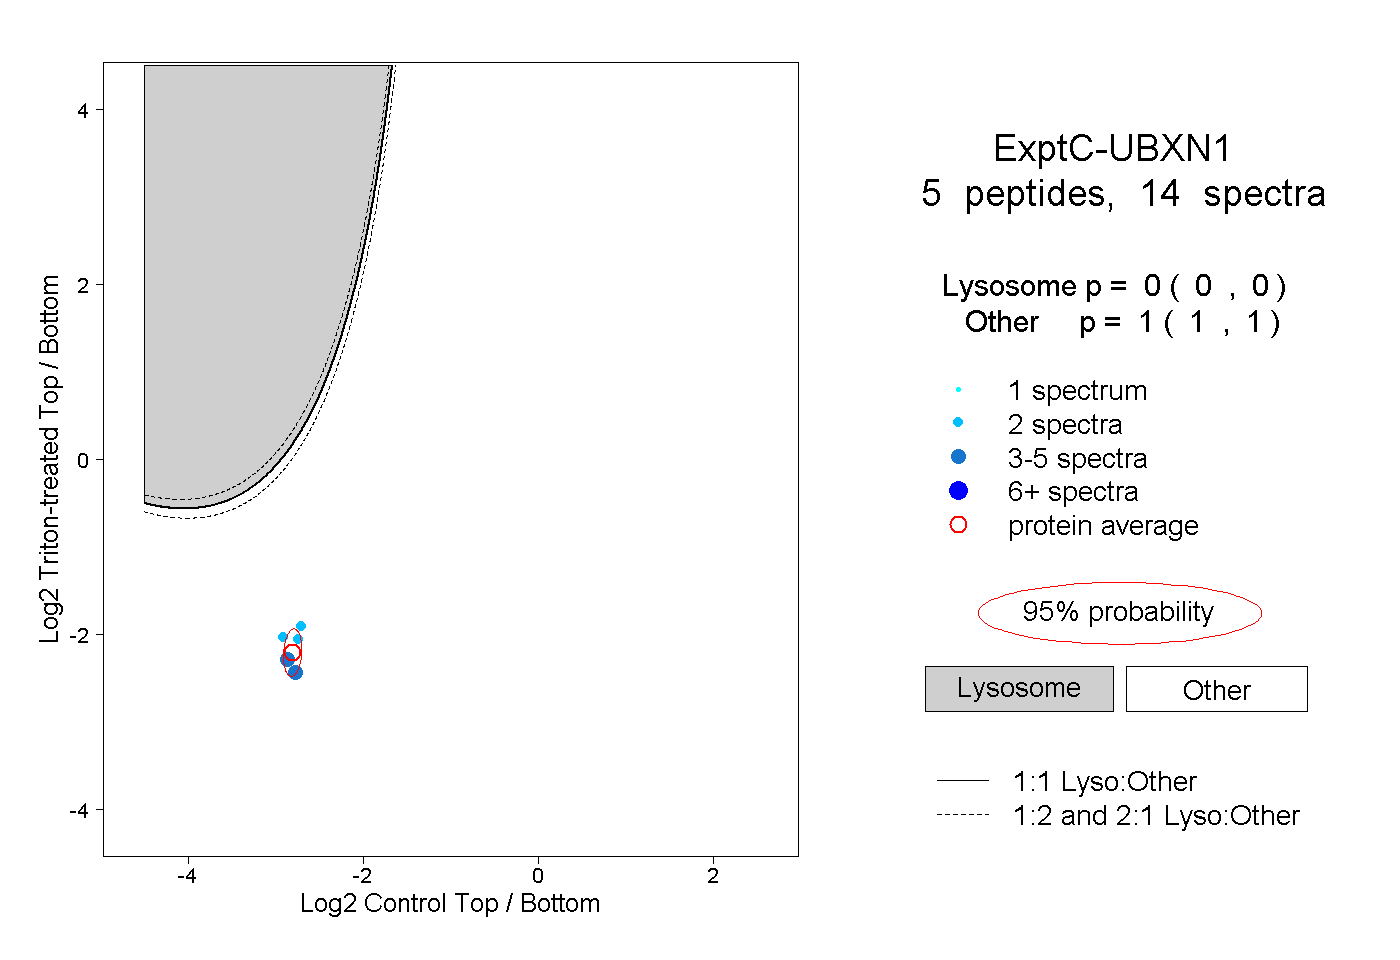
0.000 | 0.000
1.000 | 1.000
1peptide
spectrum
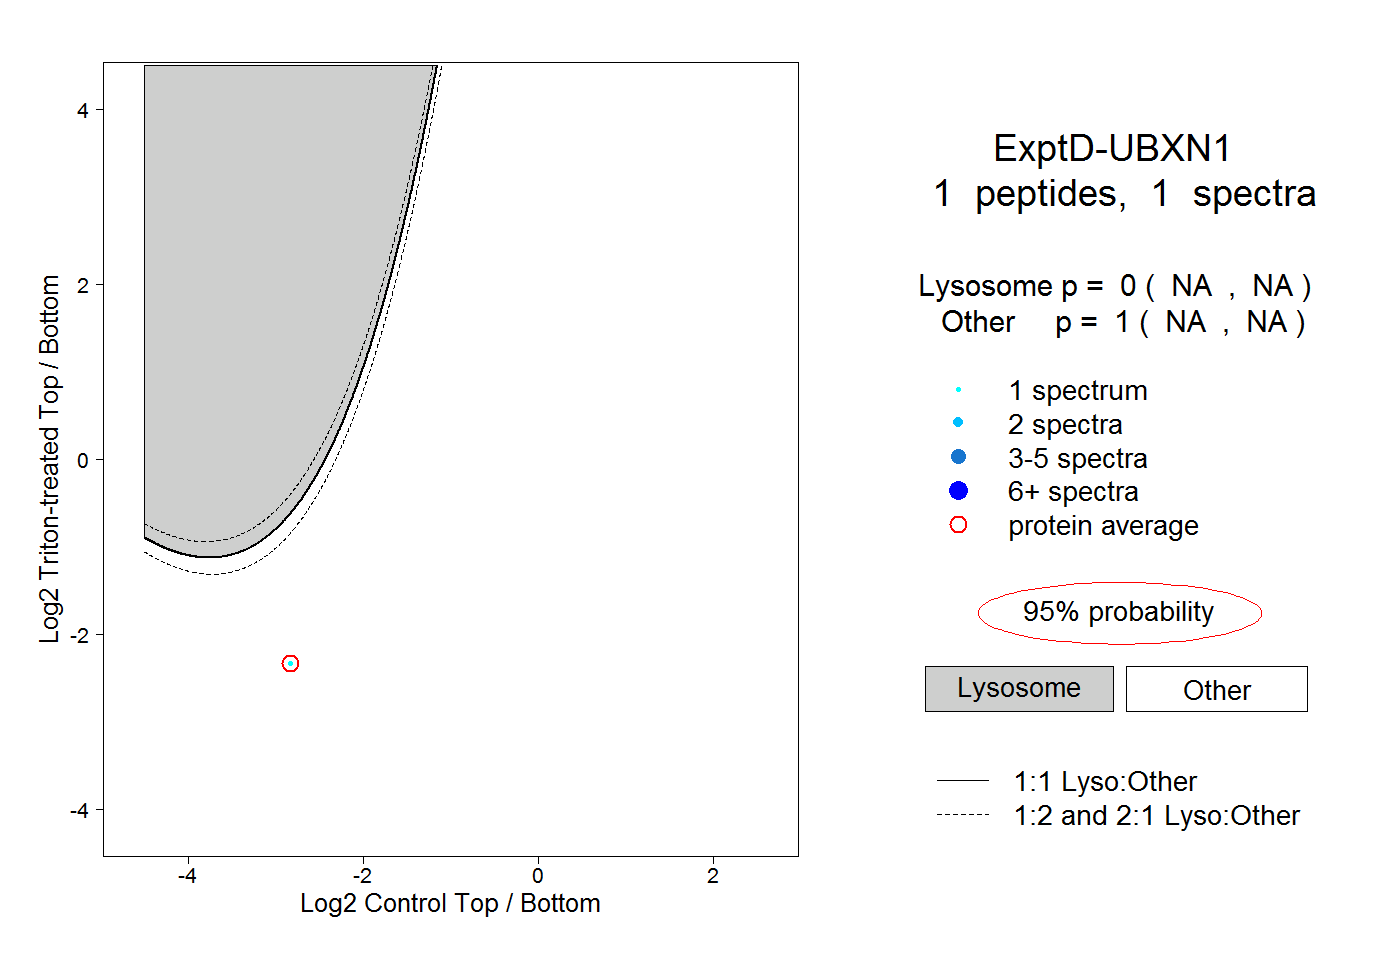
NA | NA
NA | NA