 7
7peptides
spectra
0.000 | 0.000
0.000 | 0.081
0.000 | 0.018
0.000 | 0.000
0.094 | 0.151
0.000 | 0.000
0.796 | 0.850
0.000 | 0.000
| Plot | Mito | Lyso | Perox | ER | Golgi | PM | Cytosol | Nucleus | |||||
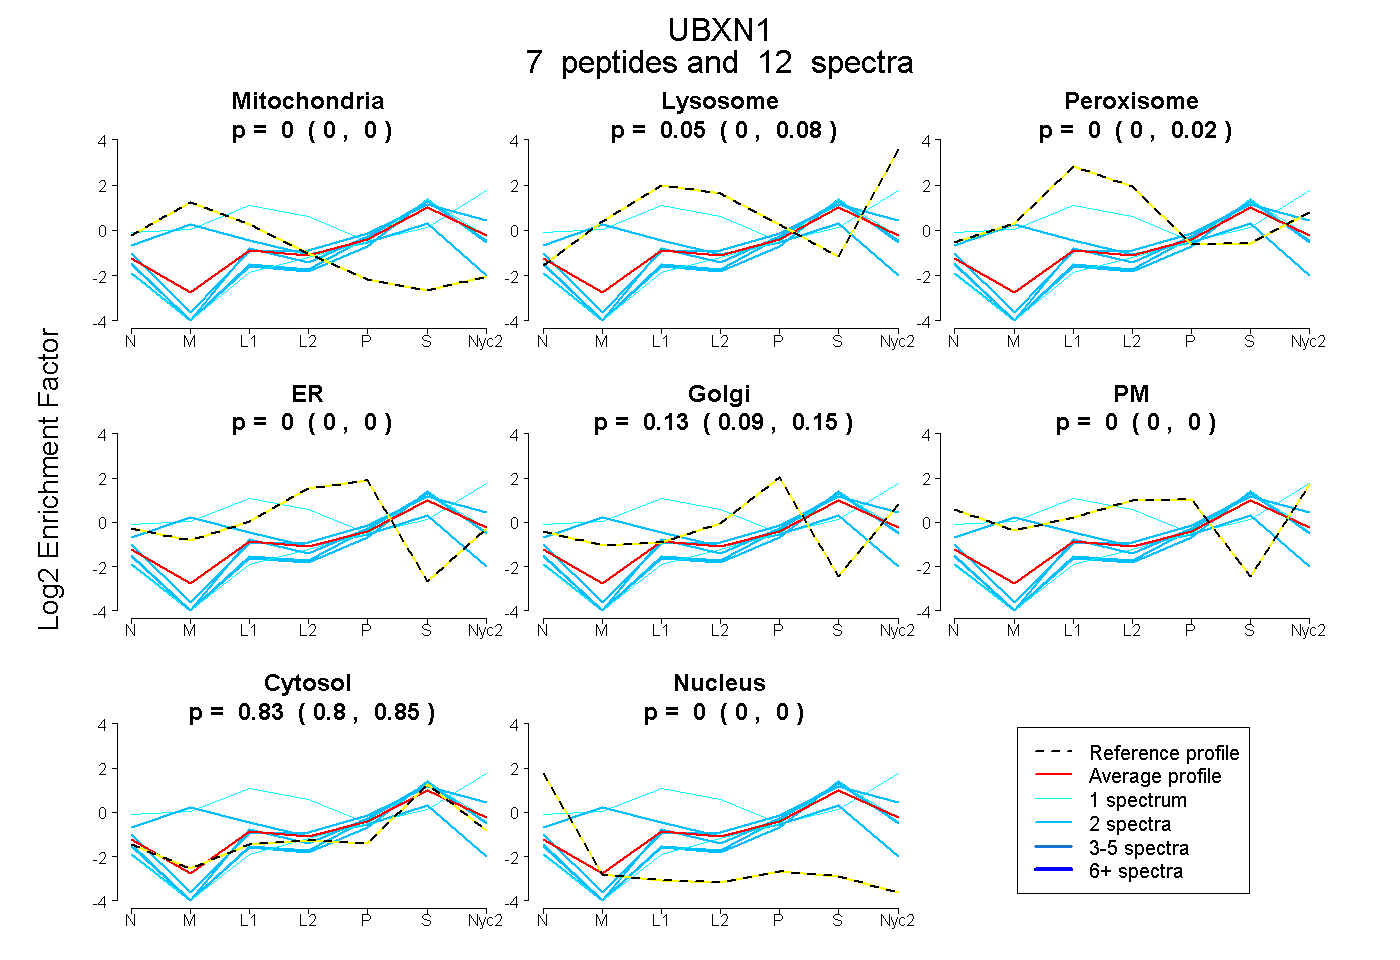
| Expt A |
7 peptides |
12 spectra |
|
0.000 0.000 | 0.000 |
0.047 0.000 | 0.081 |
0.000 0.000 | 0.018 |
0.000 0.000 | 0.000 |
0.127 0.094 | 0.151 |
0.000 0.000 | 0.000 |
0.826 0.796 | 0.850 |
0.000 0.000 | 0.000 |
| 2 spectra, EYDQCR | 0.421 | 0.000 | 0.036 | 0.064 | 0.000 | 0.000 | 0.479 | 0.000 | ||
| 1 spectrum, MLELVAQK | 0.000 | 0.000 | 0.000 | 0.000 | 0.019 | 0.000 | 0.981 | 0.000 | ||
| 2 spectra, EQLAAVR | 0.000 | 0.000 | 0.000 | 0.000 | 0.041 | 0.000 | 0.959 | 0.000 | ||
| 1 spectrum, AEELAAR | 0.000 | 0.307 | 0.324 | 0.000 | 0.000 | 0.122 | 0.247 | 0.000 | ||
| 2 spectra, YGGTVGSR | 0.000 | 0.058 | 0.000 | 0.000 | 0.134 | 0.000 | 0.808 | 0.000 | ||
| 2 spectra, QGQELSAAR | 0.000 | 0.000 | 0.000 | 0.000 | 0.066 | 0.000 | 0.934 | 0.000 | ||
| 2 spectra, LPDGTSLTQTFR | 0.000 | 0.000 | 0.000 | 0.000 | 0.000 | 0.000 | 1.000 | 0.000 |
| Plot | Mito | Lyso or Perox | ER | Golgi | PM | Cytosol | Nucleus | ||||||
| Expt B |
3 peptides |
5 spectra |
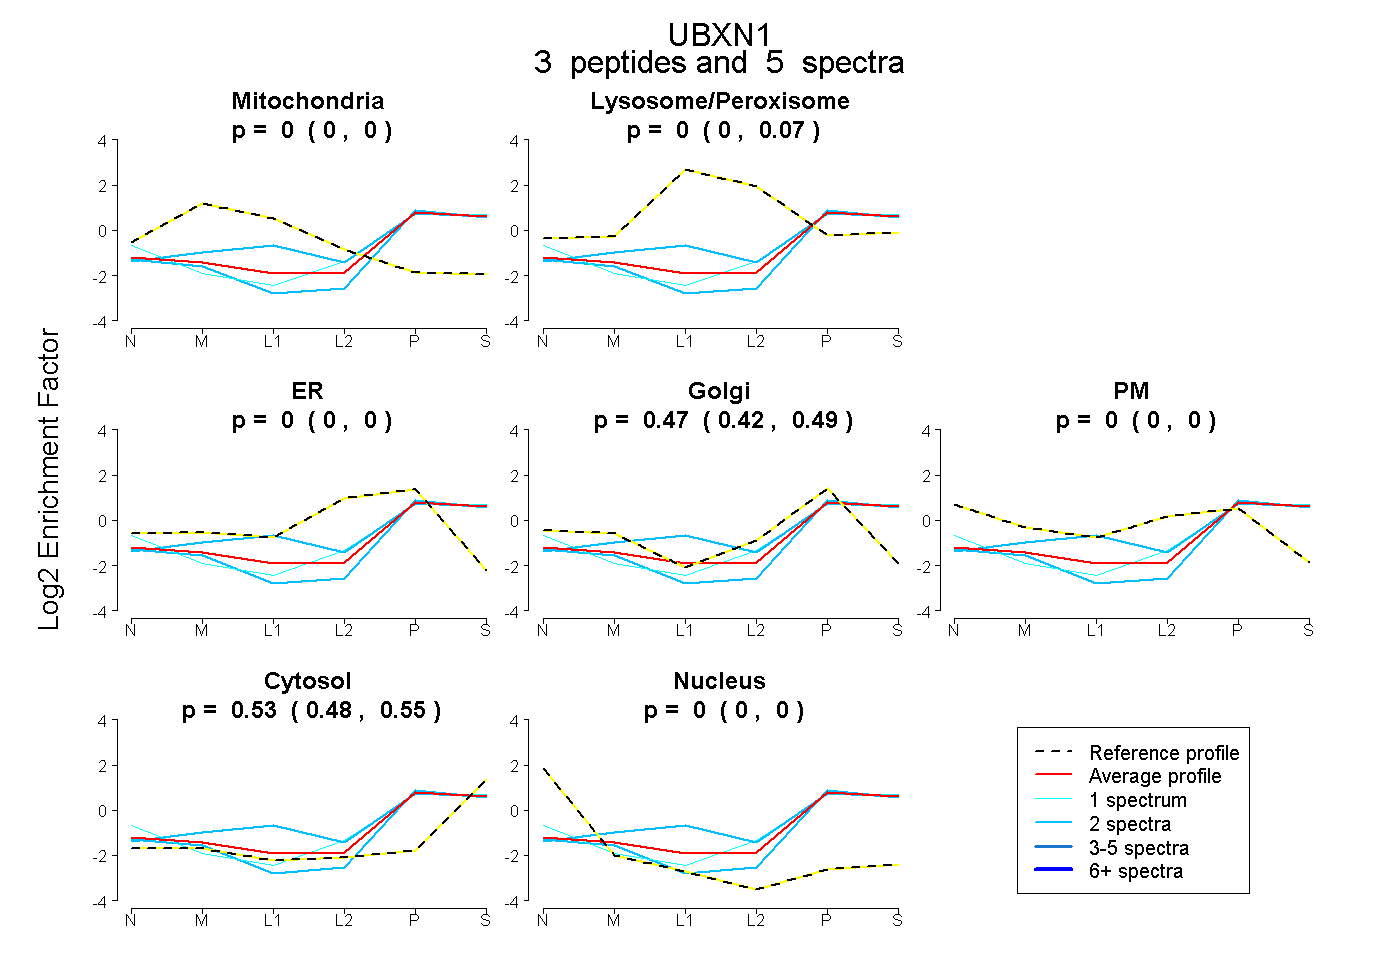 |
0.000 0.000 | 0.000 |
0.000 0.000 | 0.071 |
0.000 0.000 | 0.000 |
0.474 0.416 | 0.489 |
0.000 0.000 | 0.000 |
0.526 0.477 | 0.548 |
0.000 0.000 | 0.000 |
|||
| Plot | Lyso | Other | |||||||||||
| Expt C |
5 peptides |
14 spectra |
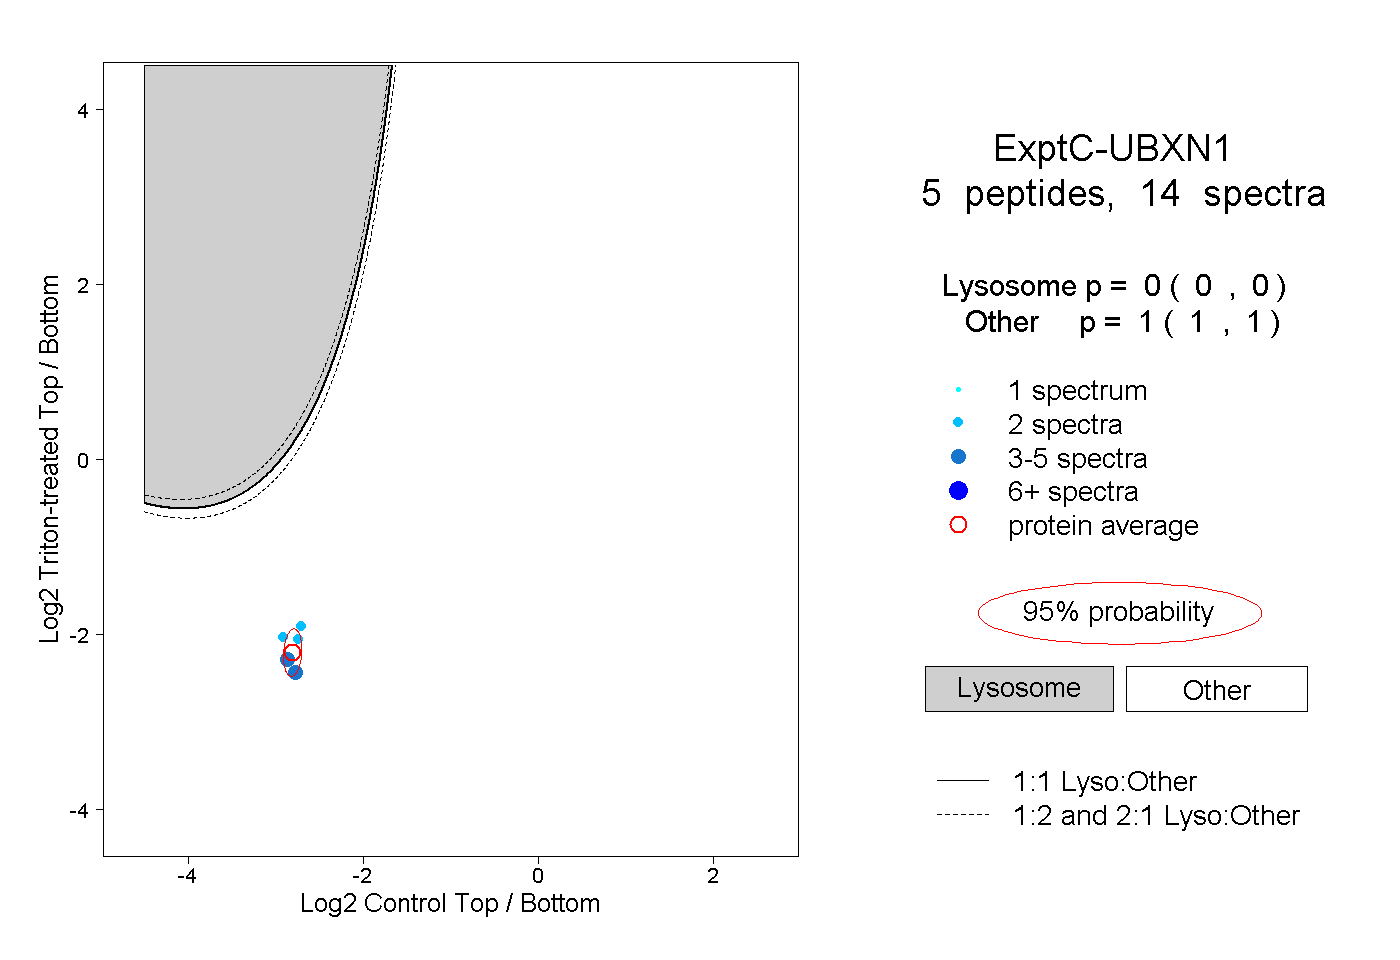 |
0.000 0.000 | 0.000 |
1.000 1.000 | 1.000 |
||||||||
| Plot | Lyso | Other | |||||||||||
| Expt D |
1 peptide |
1 spectrum |
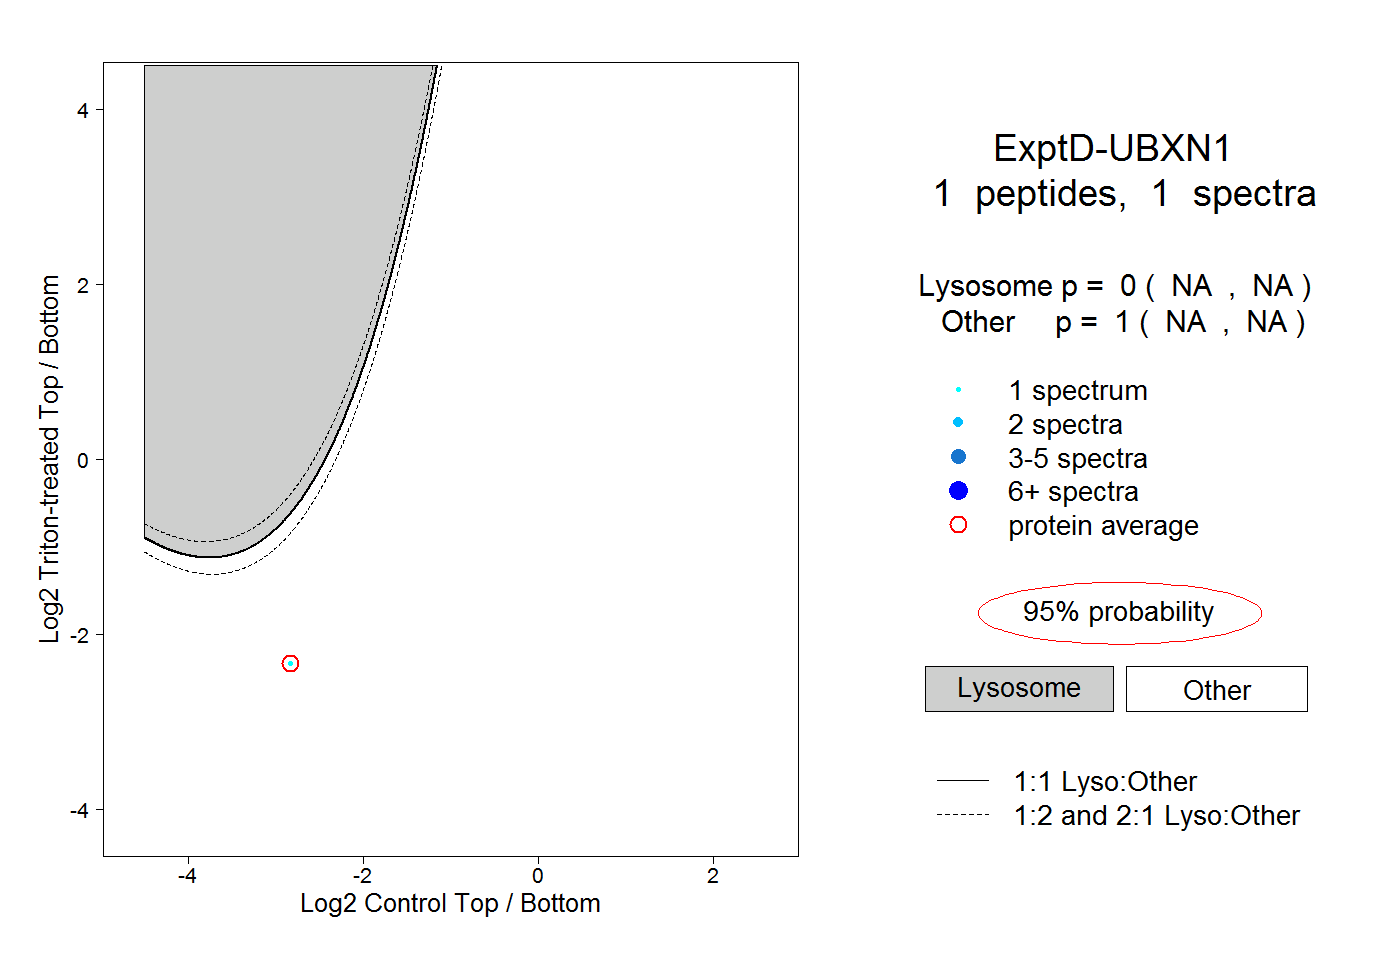 |
0.000 NA | NA |
1.000 NA | NA |