 5
5peptides
spectra
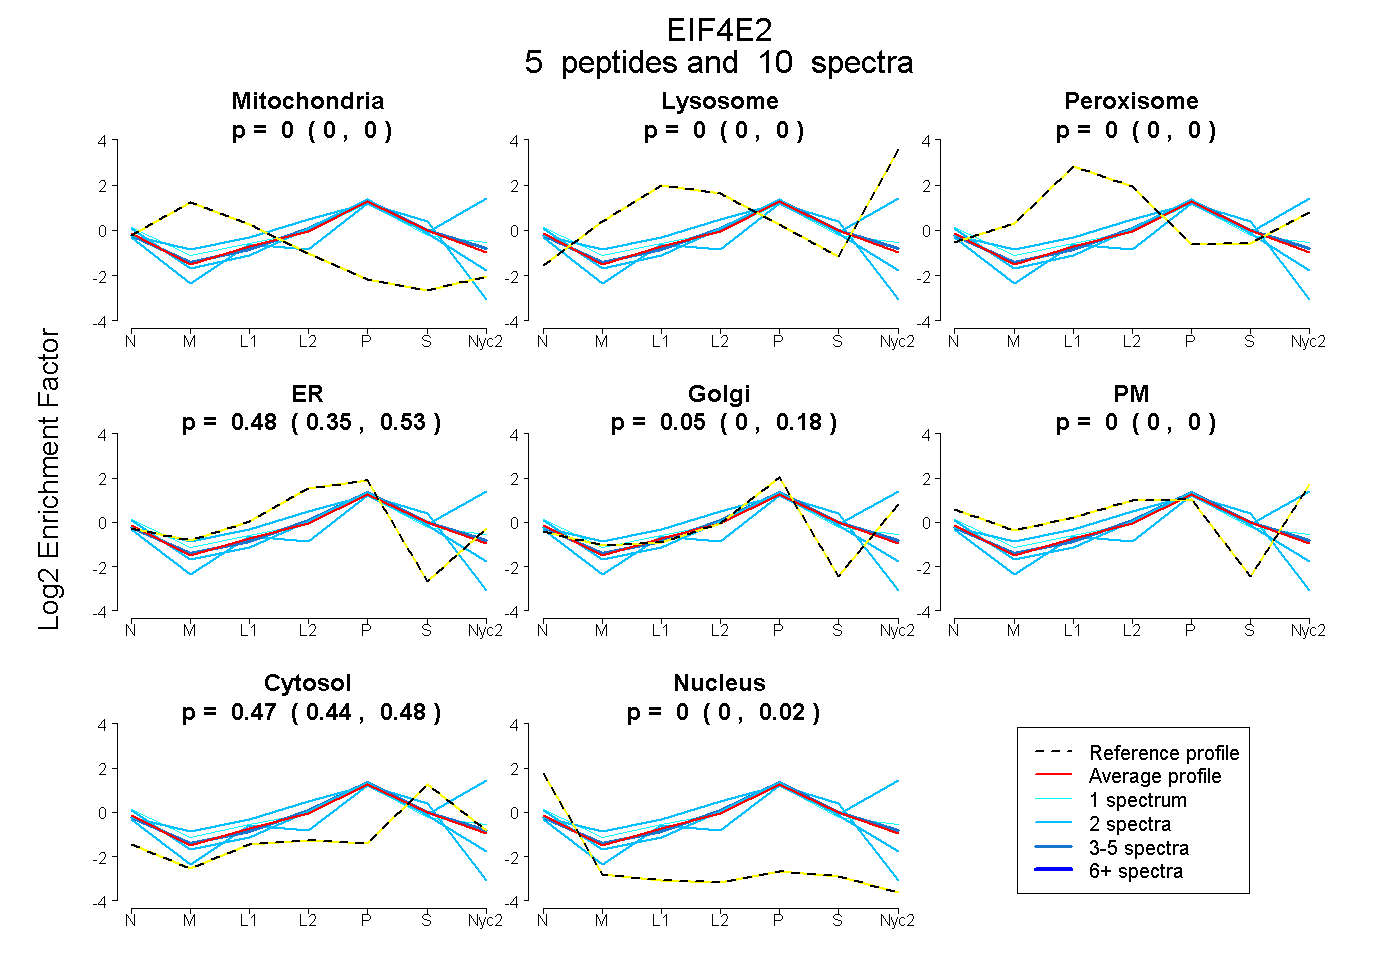
0.000 | 0.000
0.000 | 0.000
0.000 | 0.000
0.351 | 0.528
0.000 | 0.176
0.000 | 0.000
0.436 | 0.481
0.000 | 0.017
3peptides
spectra
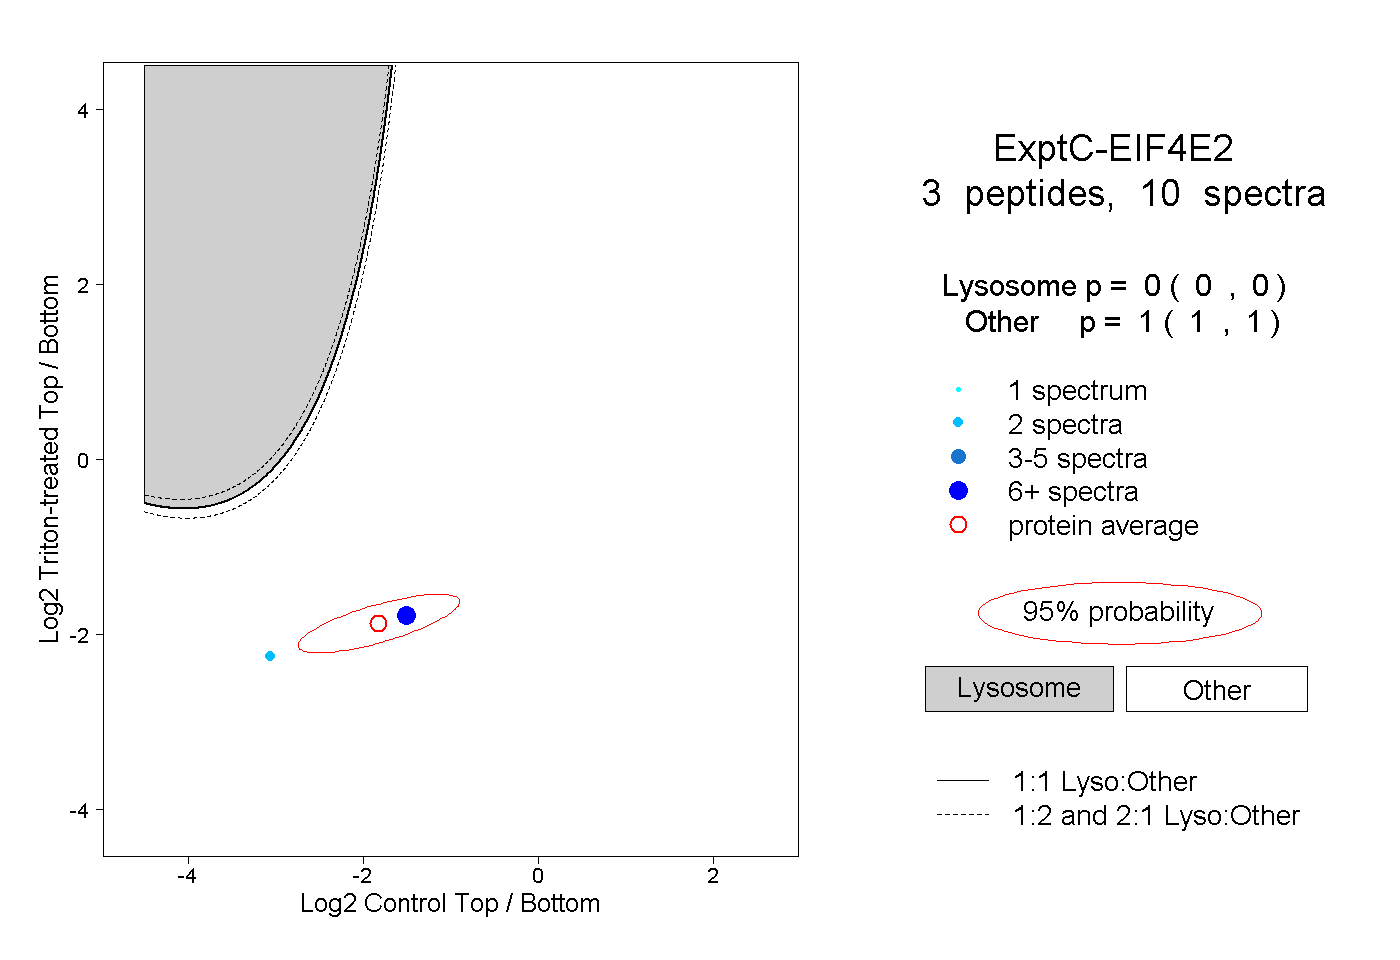
0.000 | 0.000
1.000 | 1.000
1peptide
spectra
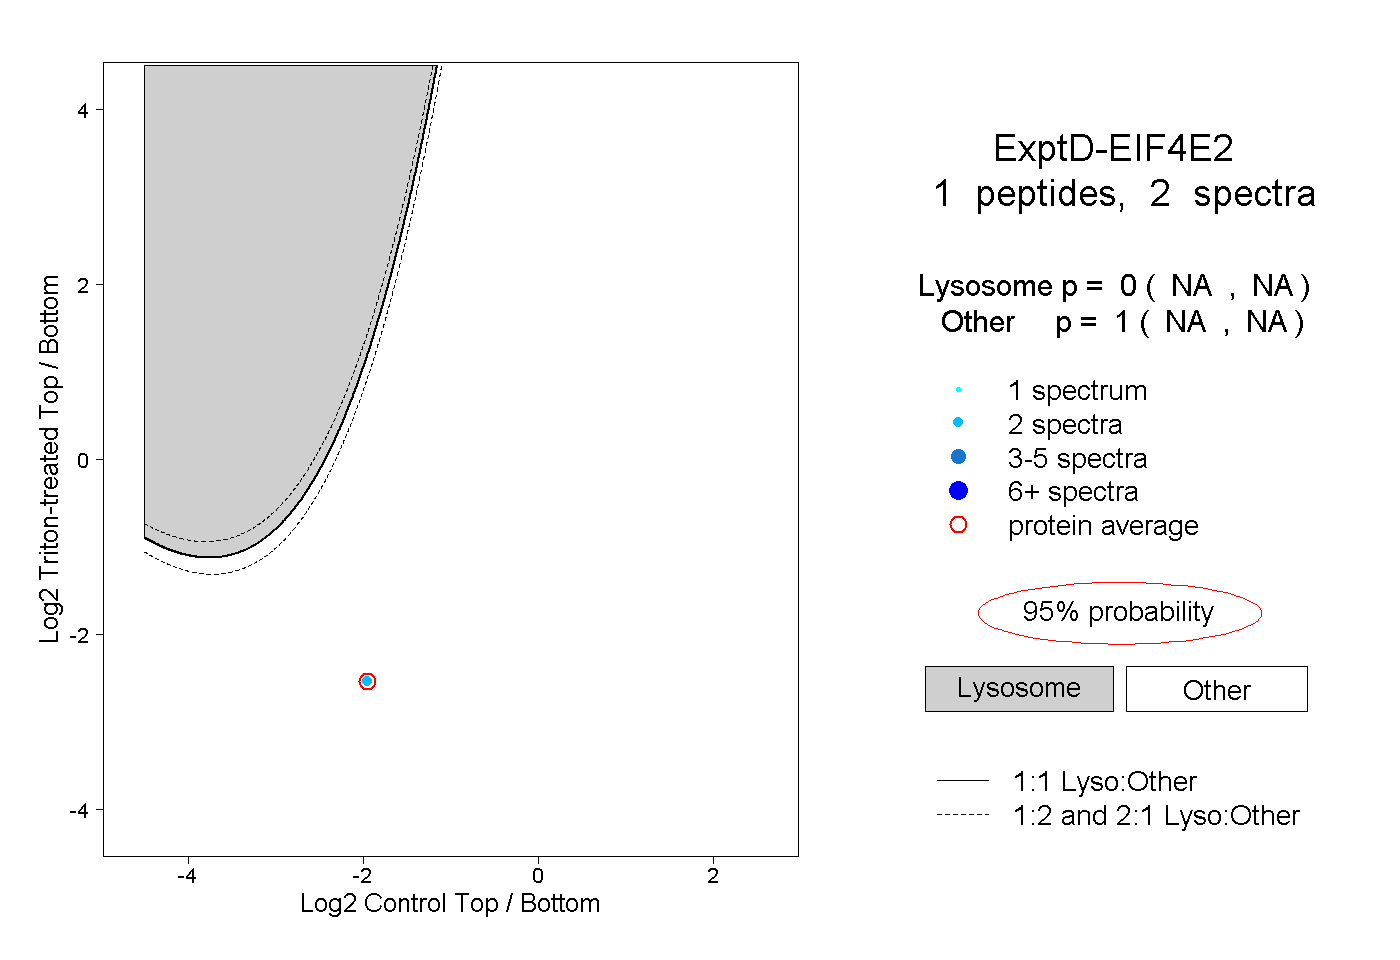
NA | NA
NA | NA