 5
5peptides
spectra
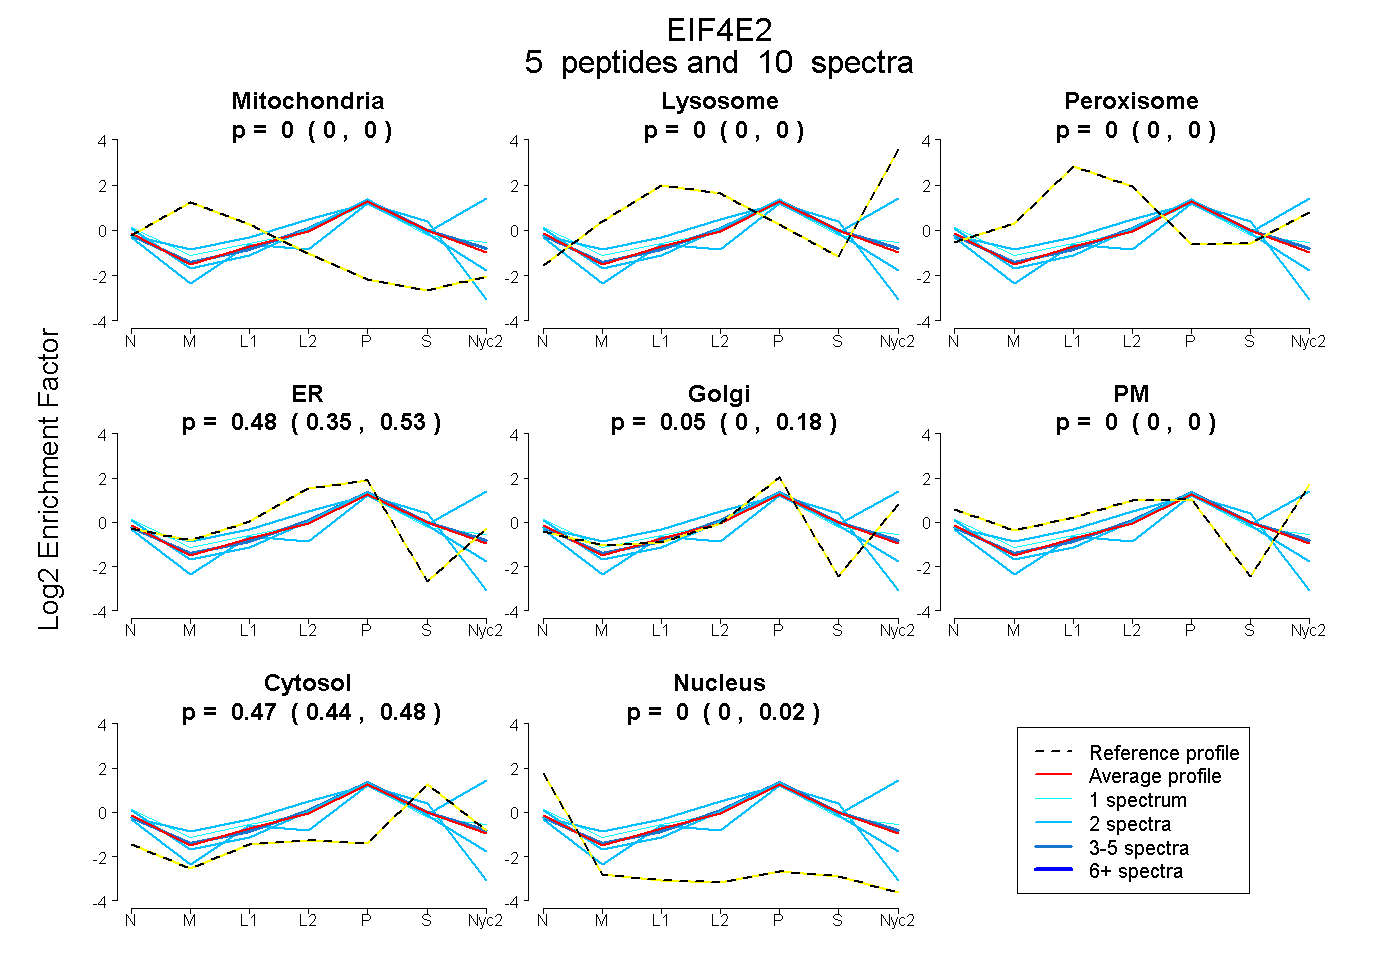
0.000 | 0.000
0.000 | 0.000
0.000 | 0.000
0.351 | 0.528
0.000 | 0.176
0.000 | 0.000
0.436 | 0.481
0.000 | 0.017
| Plot | Mito | Lyso | Perox | ER | Golgi | PM | Cytosol | Nucleus | |||||
| Expt A |
5 peptides |
10 spectra |
|
0.000 0.000 | 0.000 |
0.000 0.000 | 0.000 |
0.000 0.000 | 0.000 |
0.481 0.351 | 0.528 |
0.051 0.000 | 0.176 |
0.000 0.000 | 0.000 |
0.469 0.436 | 0.481 |
0.000 0.000 | 0.017 |
| 3 spectra, FQEDIISIWNK | 0.000 | 0.000 | 0.000 | 0.453 | 0.099 | 0.000 | 0.448 | 0.000 | ||
| 2 spectra, AVVPGPAEHPLQYNYTFWYSR | 0.000 | 0.000 | 0.000 | 0.338 | 0.000 | 0.000 | 0.527 | 0.135 | ||
| 2 spectra, TASDQATTAR | 0.000 | 0.000 | 0.000 | 0.512 | 0.000 | 0.000 | 0.407 | 0.081 | ||
| 2 spectra, SQSGGK | 0.000 | 0.231 | 0.000 | 0.000 | 0.250 | 0.242 | 0.277 | 0.000 | ||
| 1 spectrum, EGIKPMWEDDANK | 0.000 | 0.000 | 0.017 | 0.386 | 0.160 | 0.042 | 0.394 | 0.000 |
| Plot | Lyso | Other | |||||||||||
| Expt C |
3 peptides |
10 spectra |
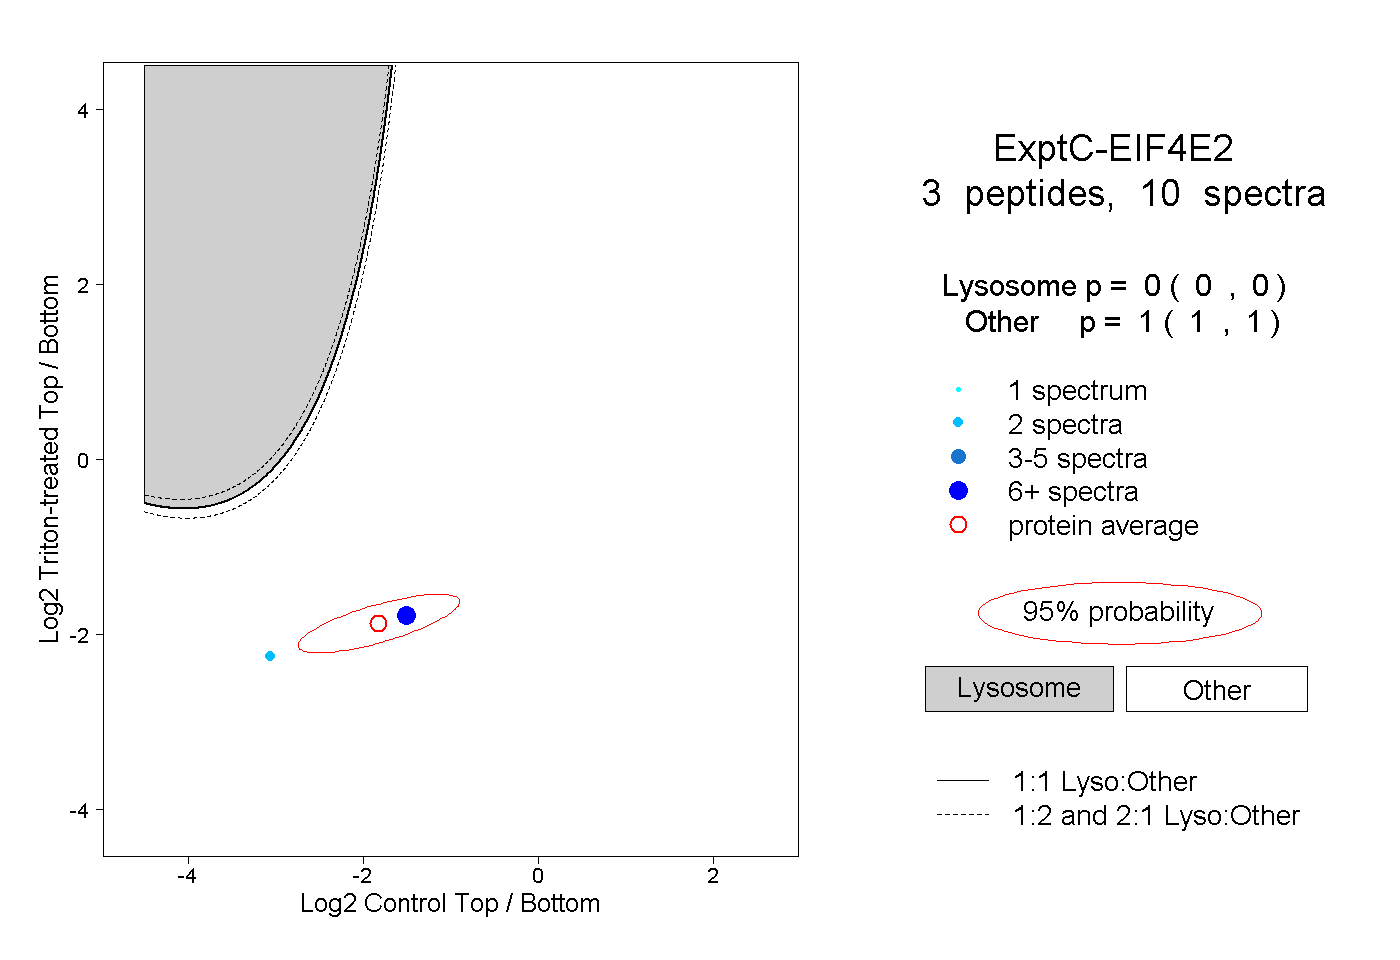 |
0.000 0.000 | 0.000 |
1.000 1.000 | 1.000 |
||||||||
| Plot | Lyso | Other | |||||||||||
| Expt D |
1 peptide |
2 spectra |
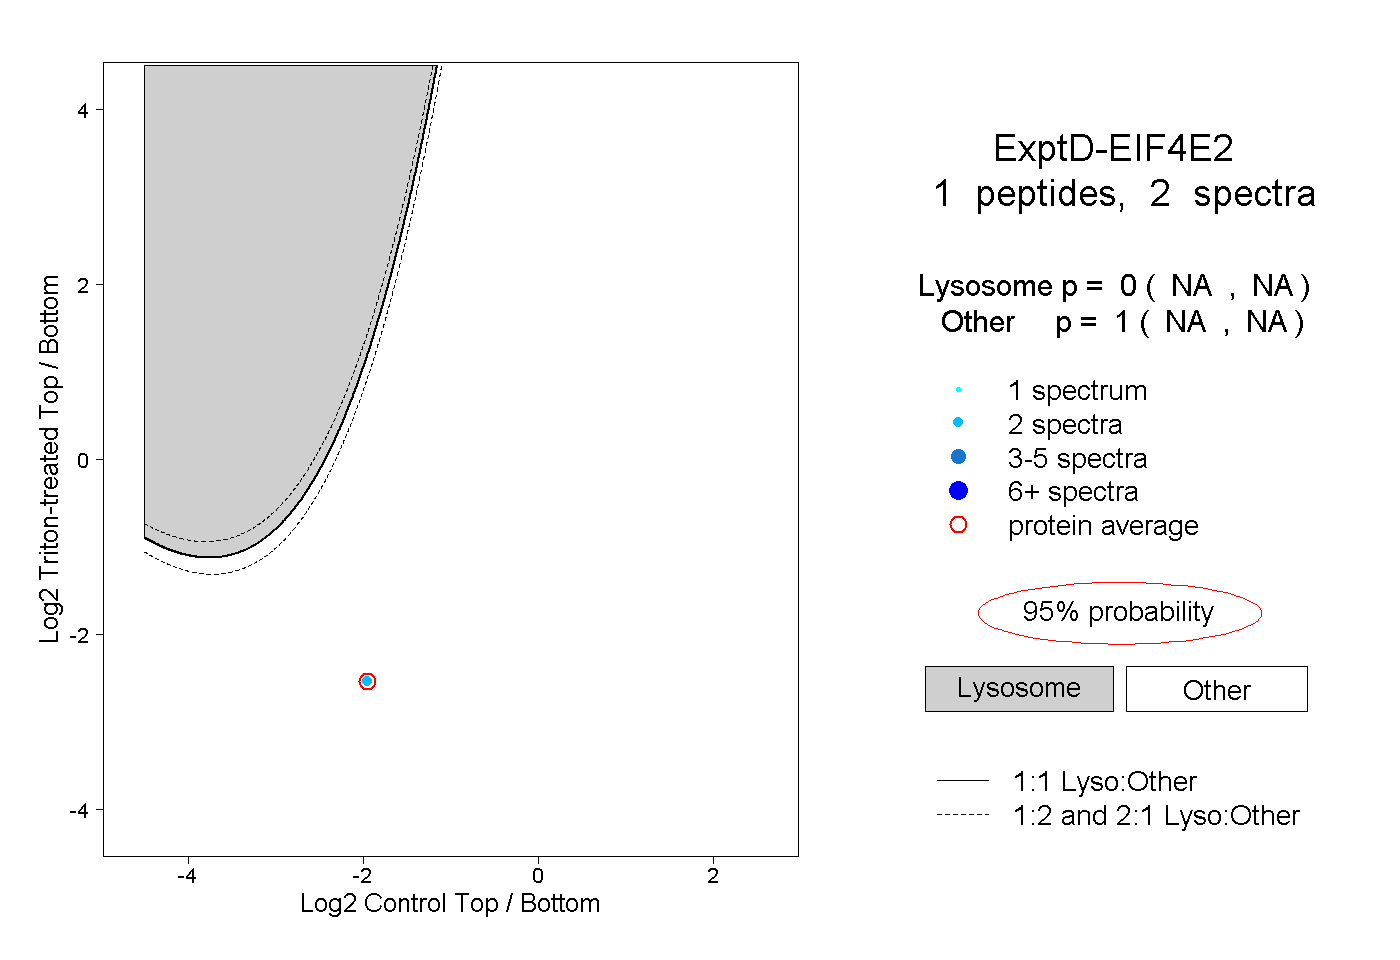 |
0.000 NA | NA |
1.000 NA | NA |