 1
1peptide
spectrum
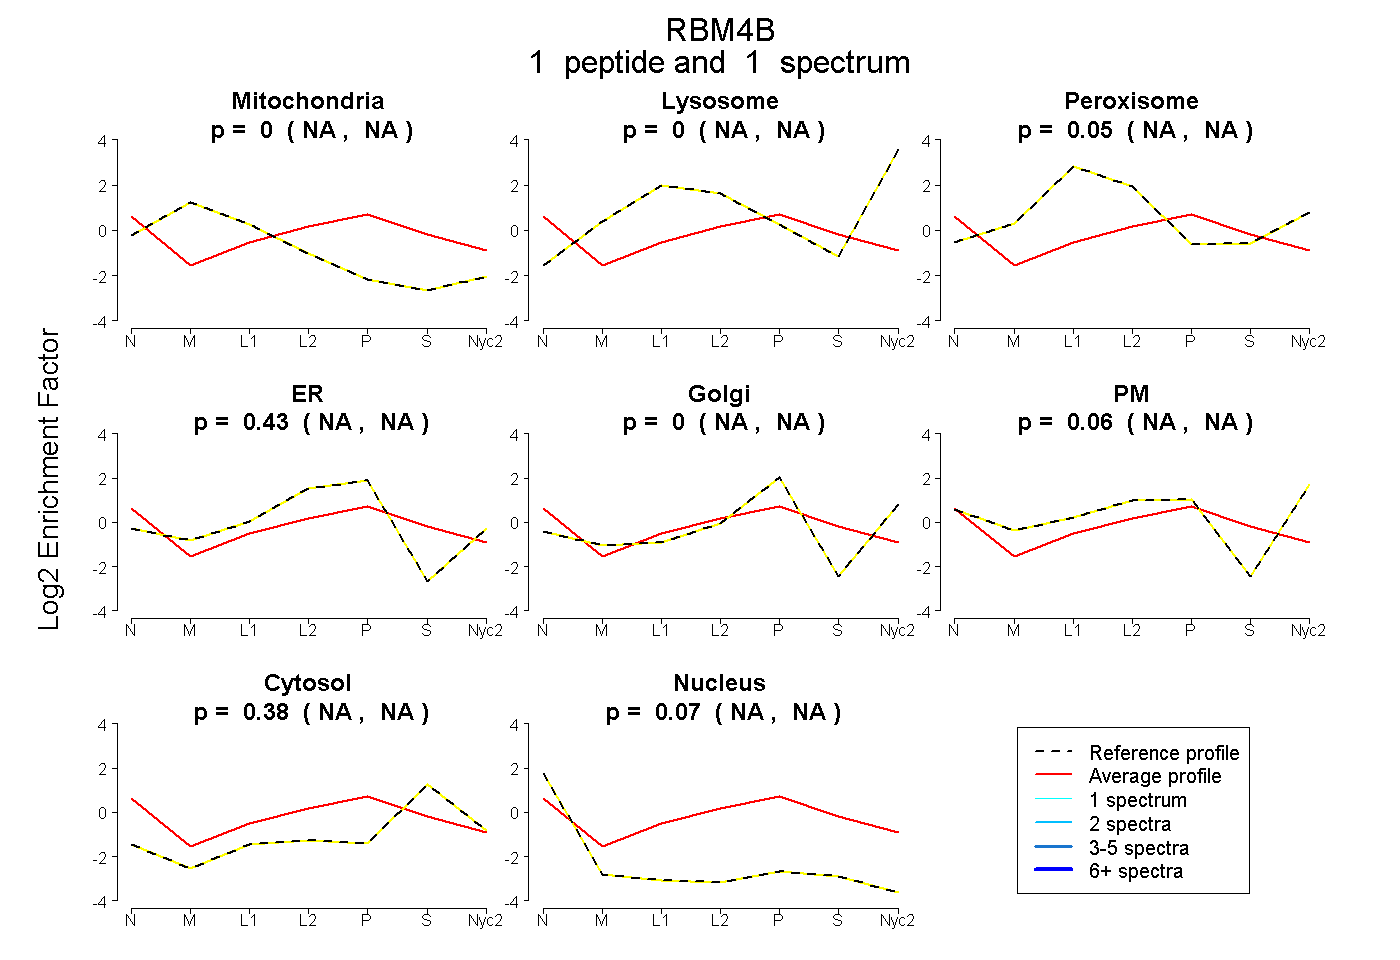
NA | NA
NA | NA
NA | NA
NA | NA
NA | NA
NA | NA
NA | NA
NA | NA
4peptides
spectra
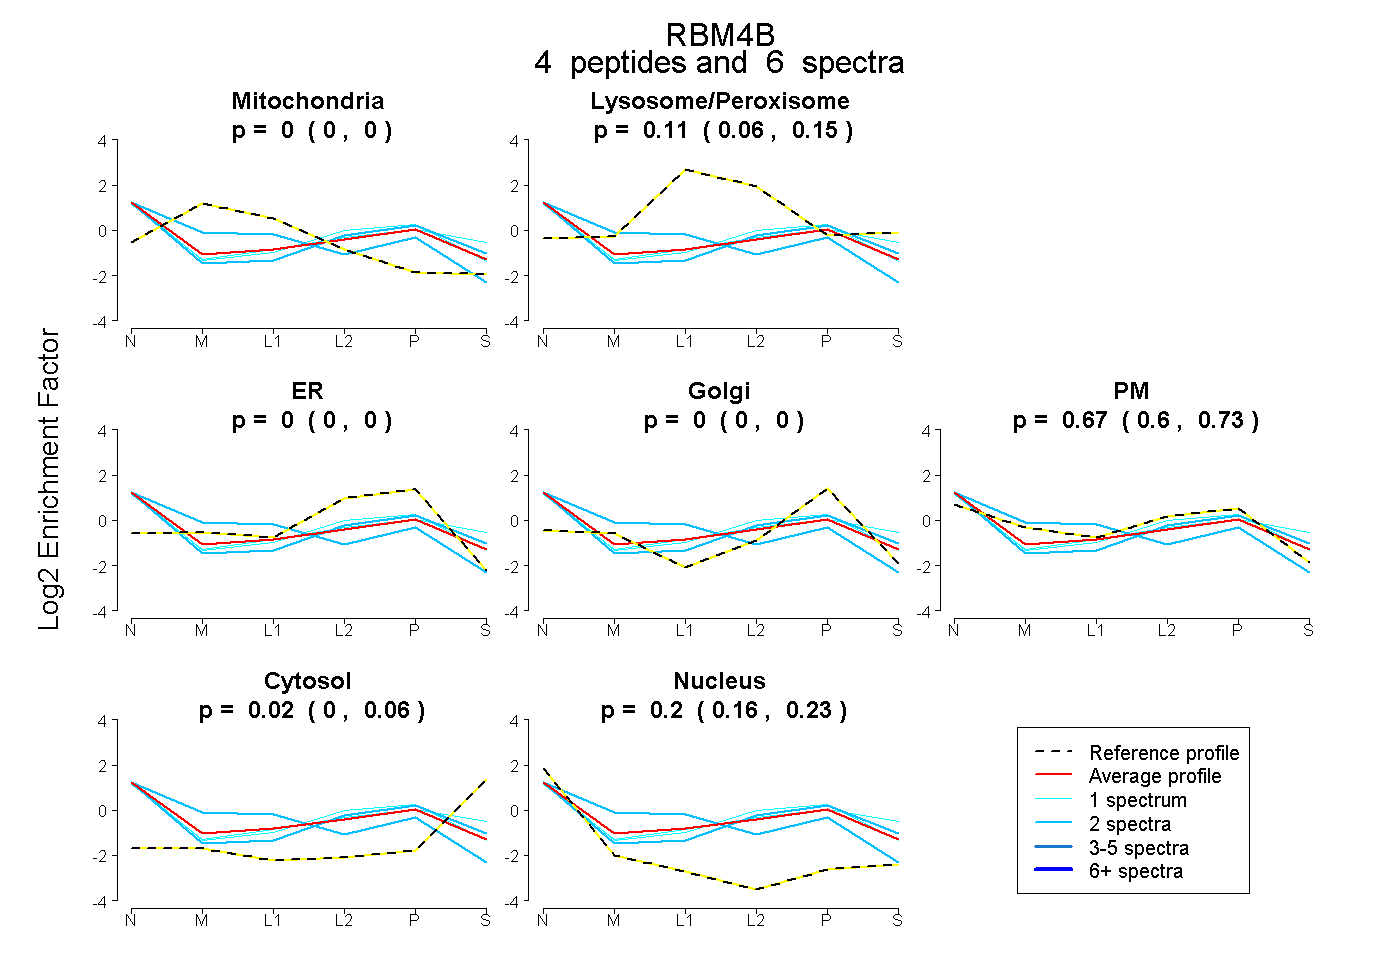
0.000 | 0.000
0.056 | 0.148
0.000 | 0.000
0.000 | 0.000
0.595 | 0.731
0.000 | 0.064
0.157 | 0.232
2peptides
spectra
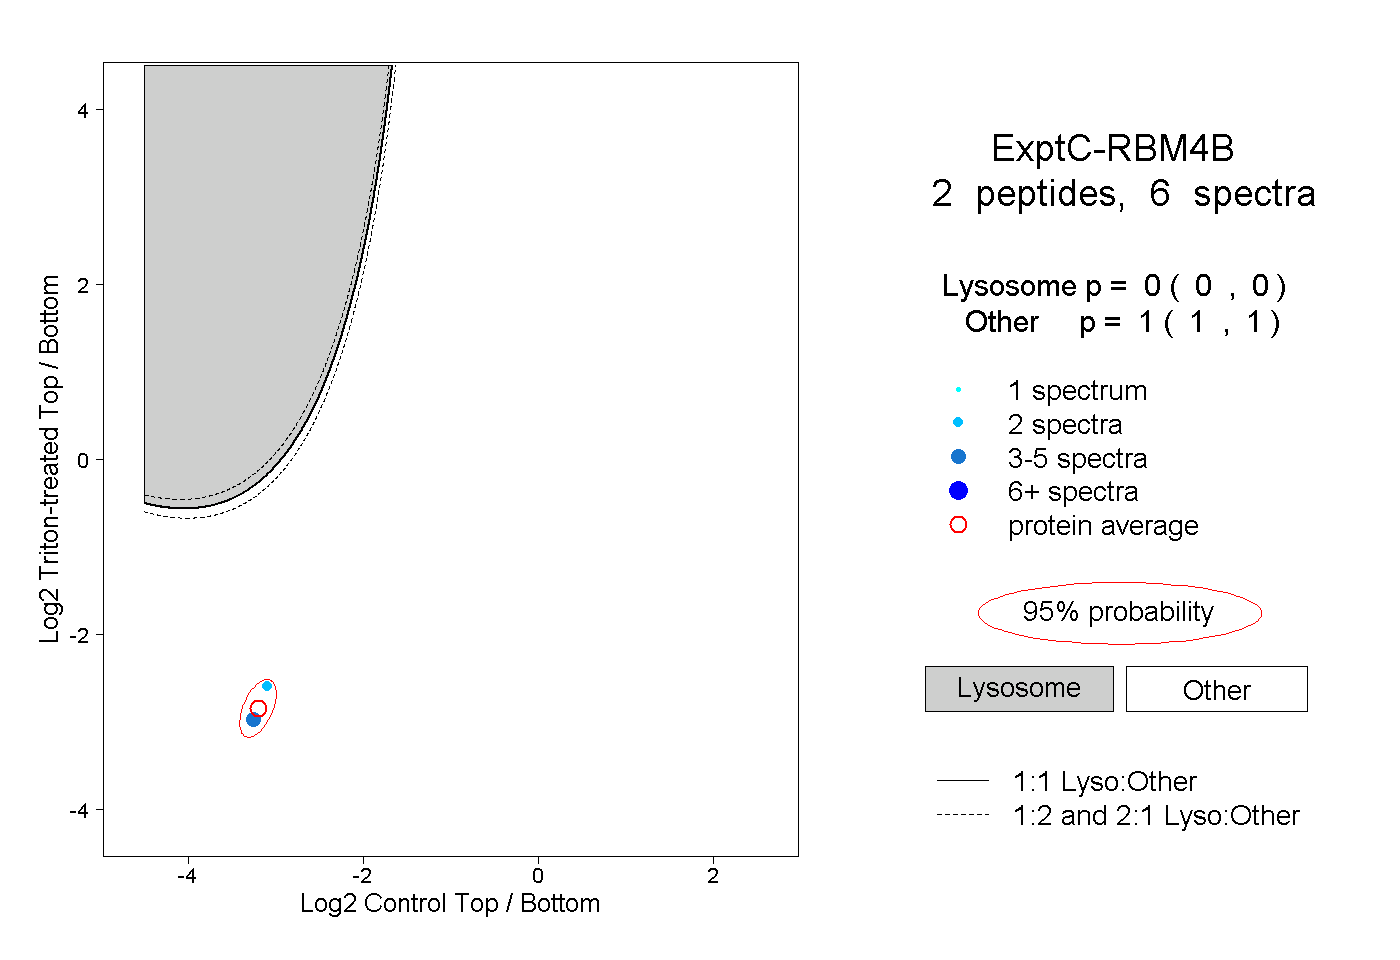
0.000 | 0.000
1.000 | 1.000
2peptides
spectra
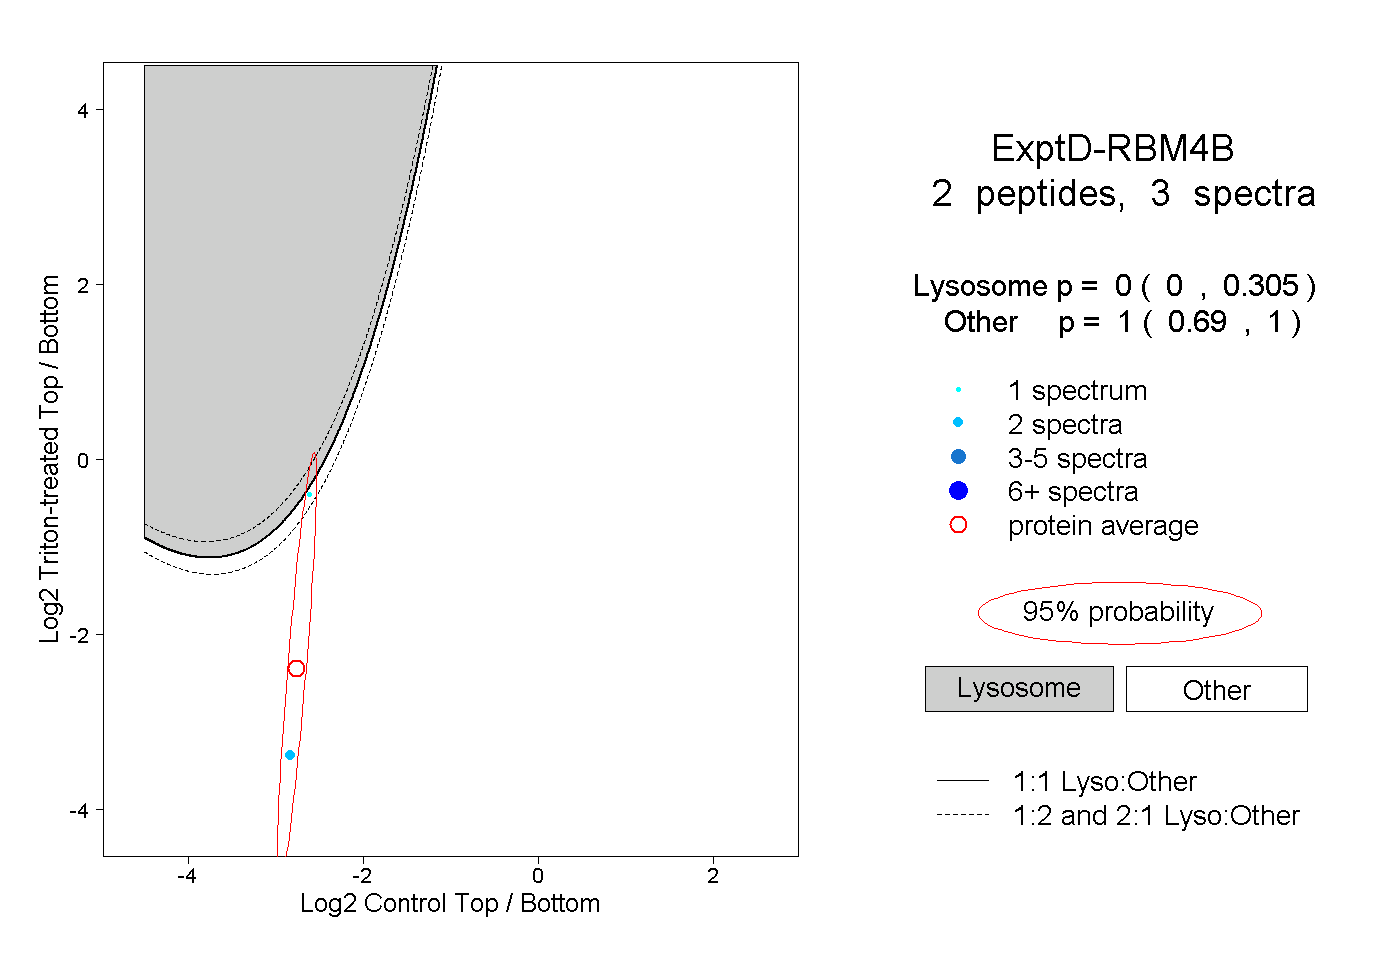
0.000 | 0.305
0.690 | 1.000