 1
1peptide
spectrum
NA | NA
NA | NA
NA | NA
NA | NA
NA | NA
NA | NA
NA | NA
NA | NA
4peptides
spectra
0.000 | 0.000
0.056 | 0.148
0.000 | 0.000
0.000 | 0.000
0.595 | 0.731
0.000 | 0.064
0.157 | 0.232
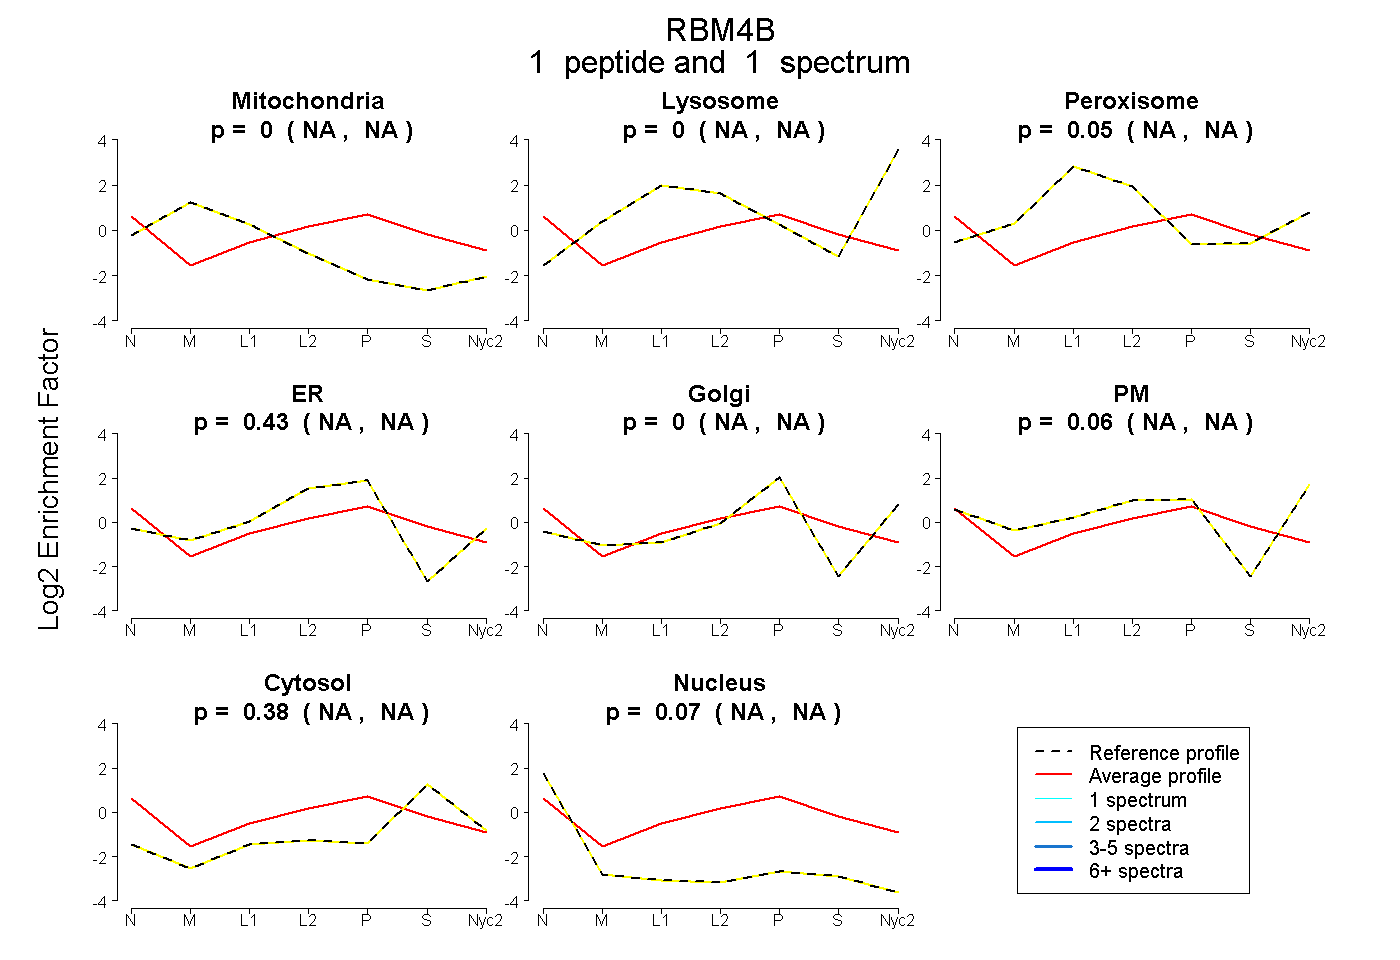
| Plot | Mito | Lyso | Perox | ER | Golgi | PM | Cytosol | Nucleus | |||||
| Expt A |
1 peptide |
1 spectrum |
|
0.000 NA | NA |
0.000 NA | NA |
0.048 NA | NA |
0.431 NA | NA |
0.000 NA | NA |
0.061 NA | NA |
0.385 NA | NA |
0.075 NA | NA |
||
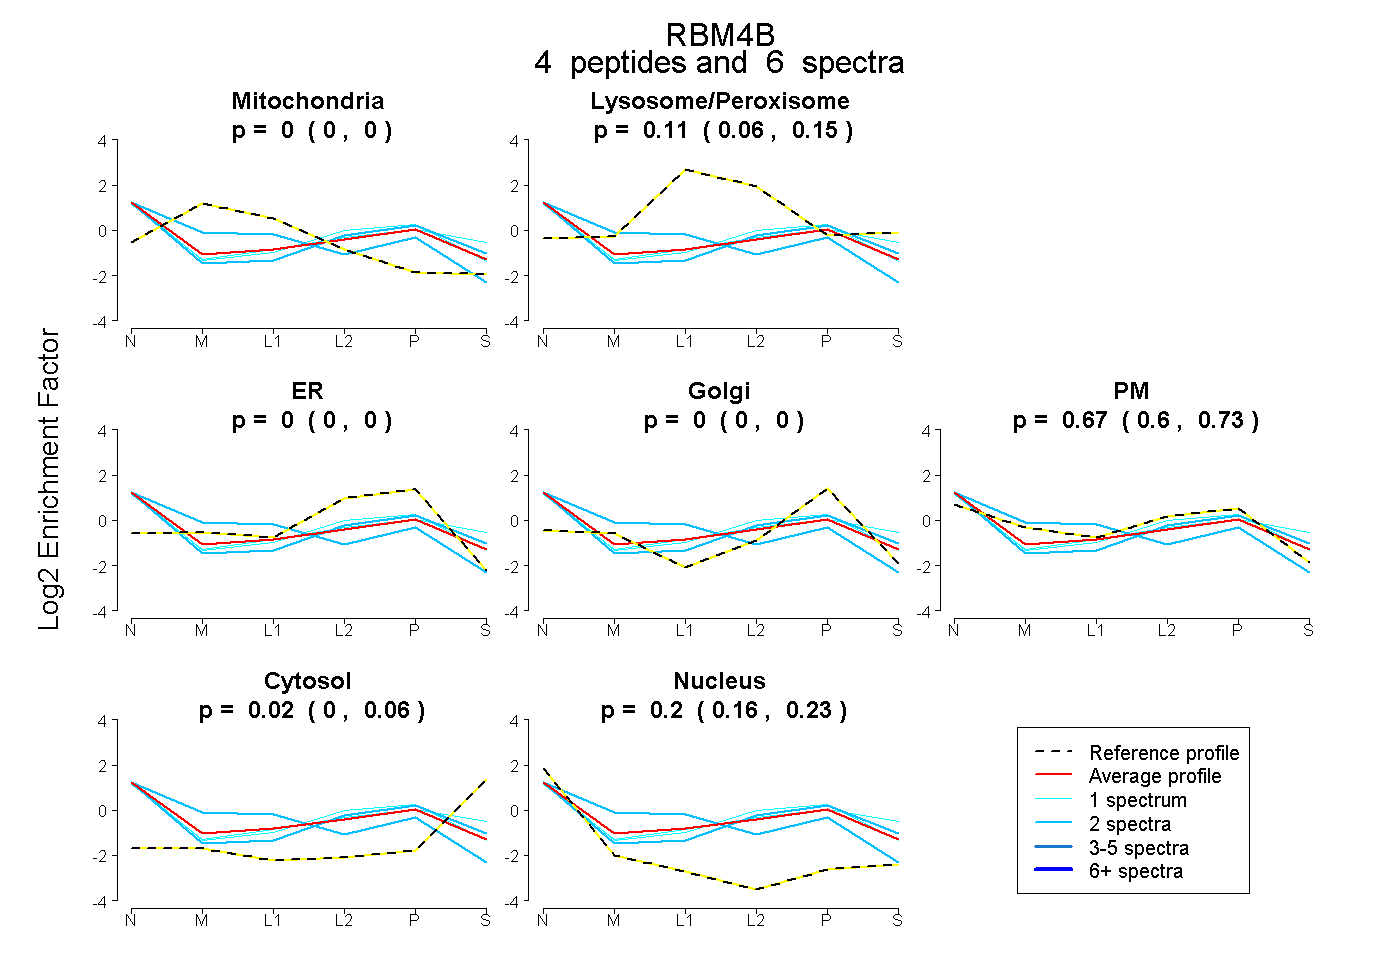
| Plot | Mito | Lyso or Perox | ER | Golgi | PM | Cytosol | Nucleus | ||||||
| Expt B |
4 peptides |
6 spectra |
|
0.000 0.000 | 0.000 |
0.109 0.056 | 0.148 |
0.000 0.000 | 0.000 |
0.000 0.000 | 0.000 |
0.666 0.595 | 0.731 |
0.024 0.000 | 0.064 |
0.201 0.157 | 0.232 |
| 2 spectra, LFIGNLPR | 0.000 | 0.000 | 0.000 | 0.000 | 0.767 | 0.115 | 0.119 | |||
| 2 spectra, LHVGNISPTCTNQELR | 0.241 | 0.001 | 0.000 | 0.000 | 0.588 | 0.000 | 0.169 | |||
| 1 spectrum, EATEQEIR | 0.000 | 0.144 | 0.000 | 0.000 | 0.565 | 0.154 | 0.137 | |||
| 1 spectrum, AEDAVEAIR | 0.000 | 0.069 | 0.000 | 0.000 | 0.765 | 0.019 | 0.147 |
| Plot | Lyso | Other | |||||||||||
| Expt C |
2 peptides |
6 spectra |
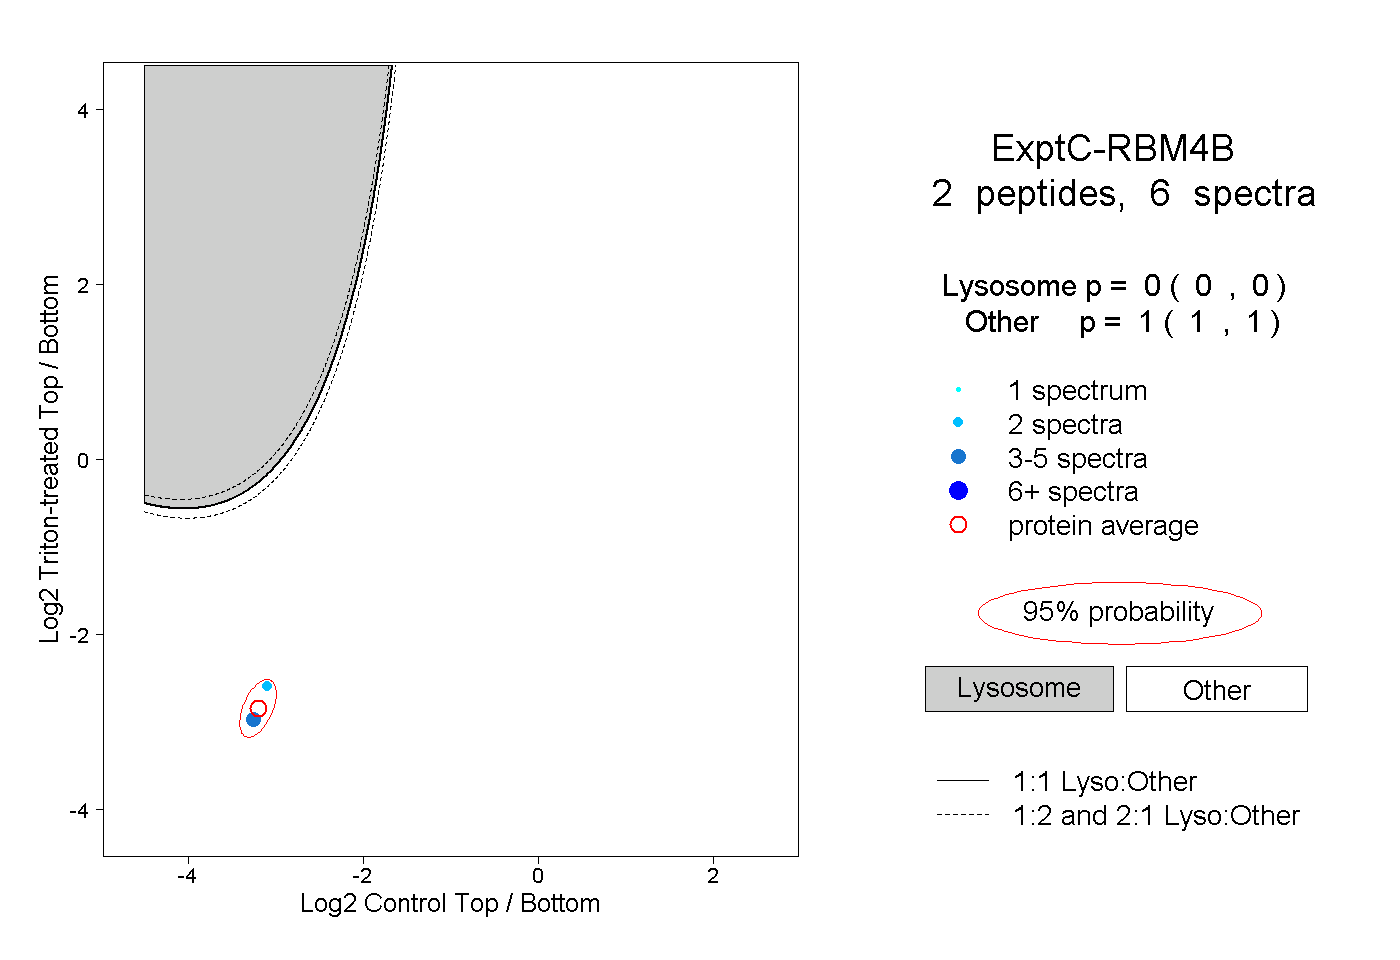 |
0.000 0.000 | 0.000 |
1.000 1.000 | 1.000 |
||||||||
| Plot | Lyso | Other | |||||||||||
| Expt D |
2 peptides |
3 spectra |
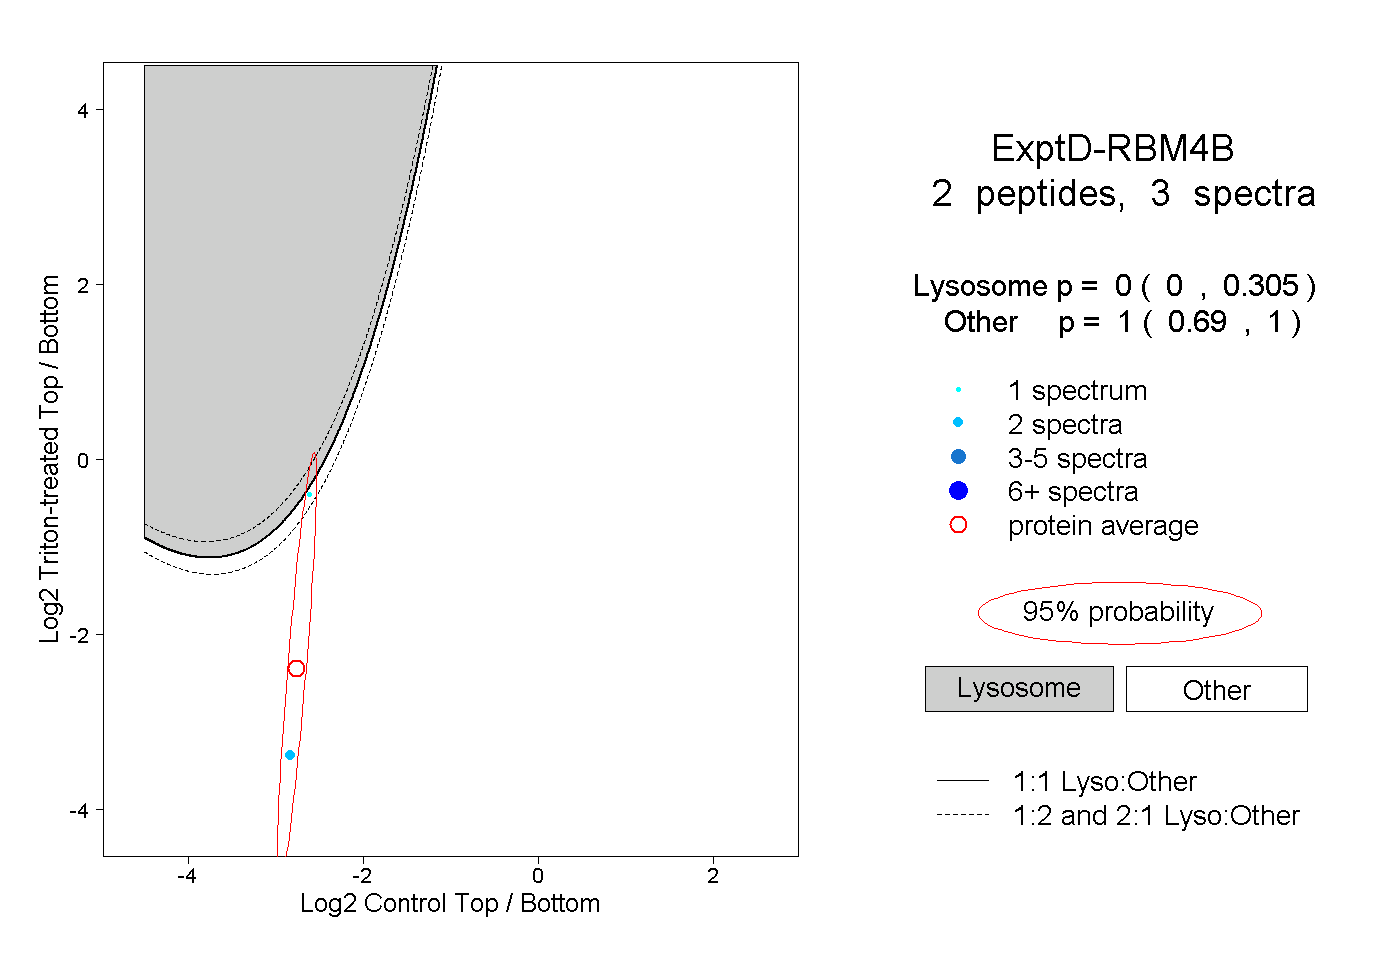 |
0.000 0.000 | 0.305 |
1.000 0.690 | 1.000 |