 19
19peptides
spectra
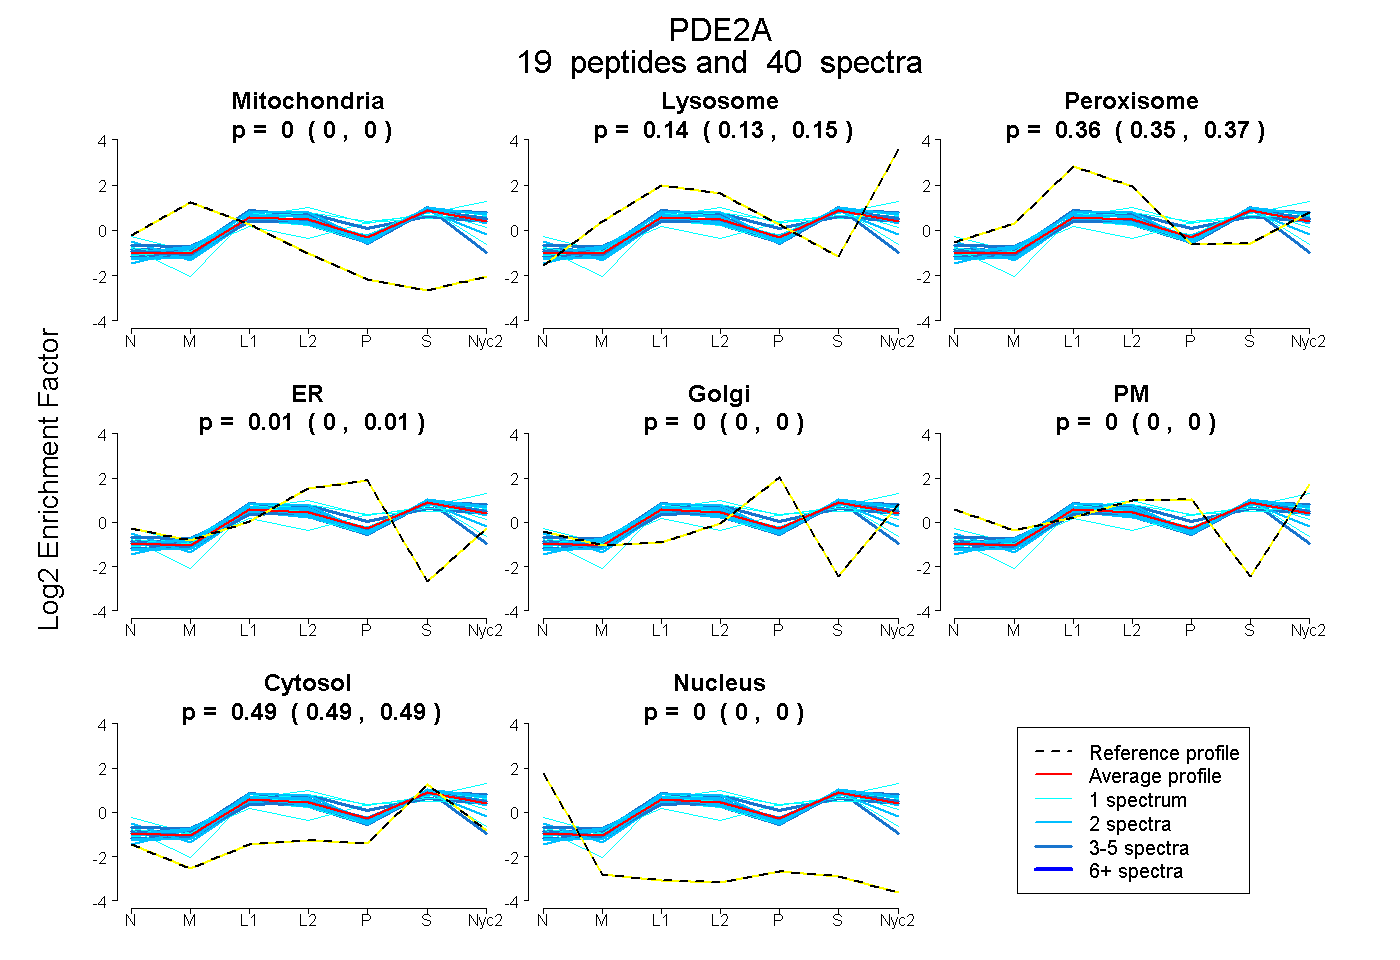
0.000 | 0.000
0.131 | 0.150
0.351 | 0.368
0.001 | 0.010
0.000 | 0.000
0.000 | 0.000
0.490 | 0.495
0.000 | 0.000
3peptides
spectra
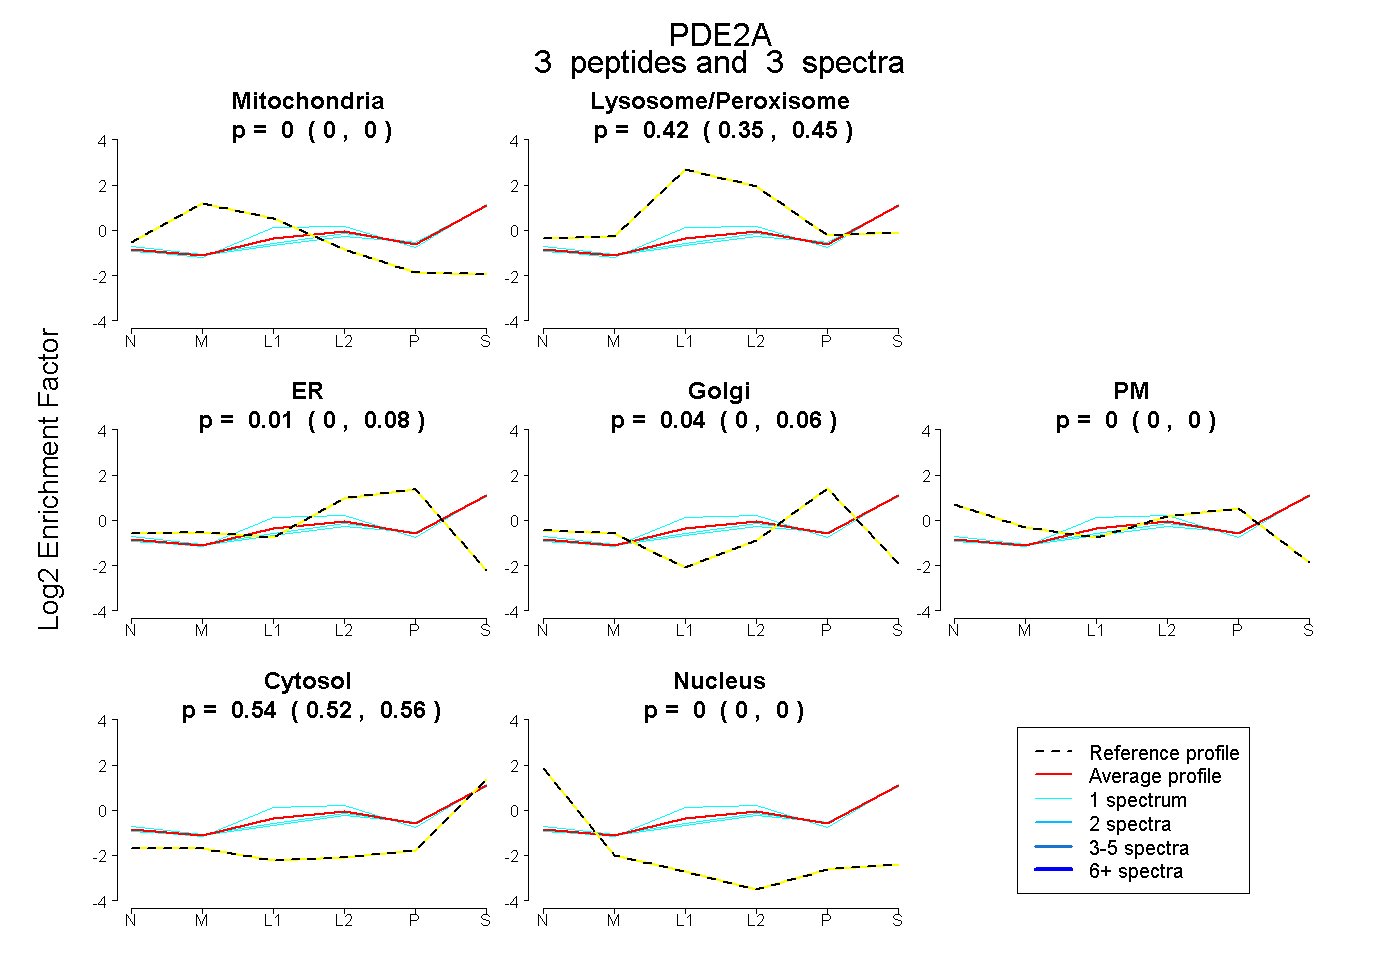
0.000 | 0.000
0.349 | 0.454
0.000 | 0.080
0.000 | 0.059
0.000 | 0.002
0.517 | 0.561
0.000 | 0.000
23peptides
spectra
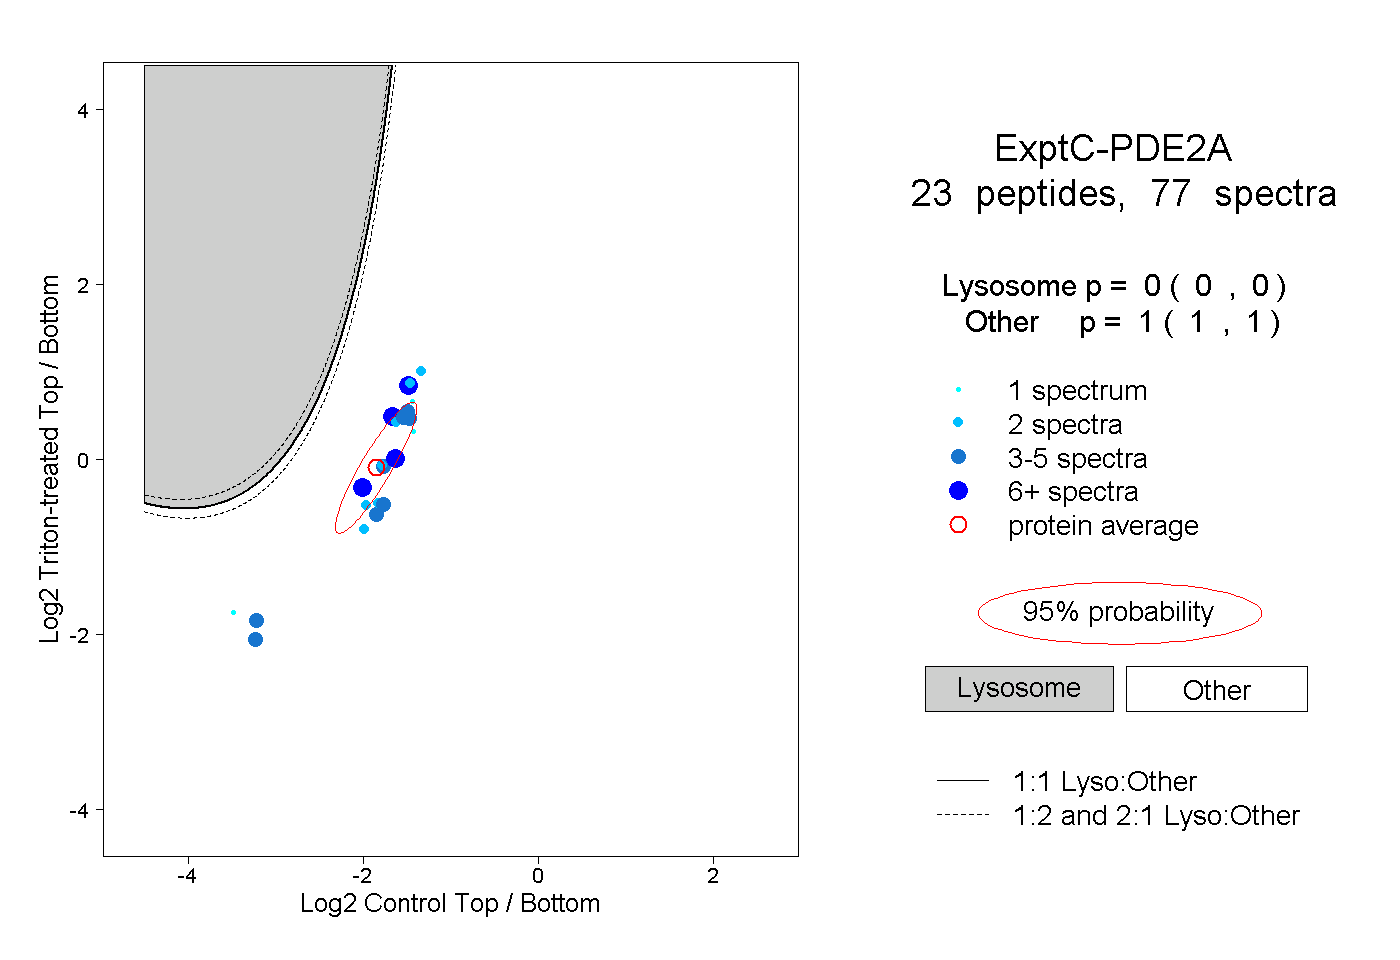
0.000 | 0.000
1.000 | 1.000
9peptides
spectra
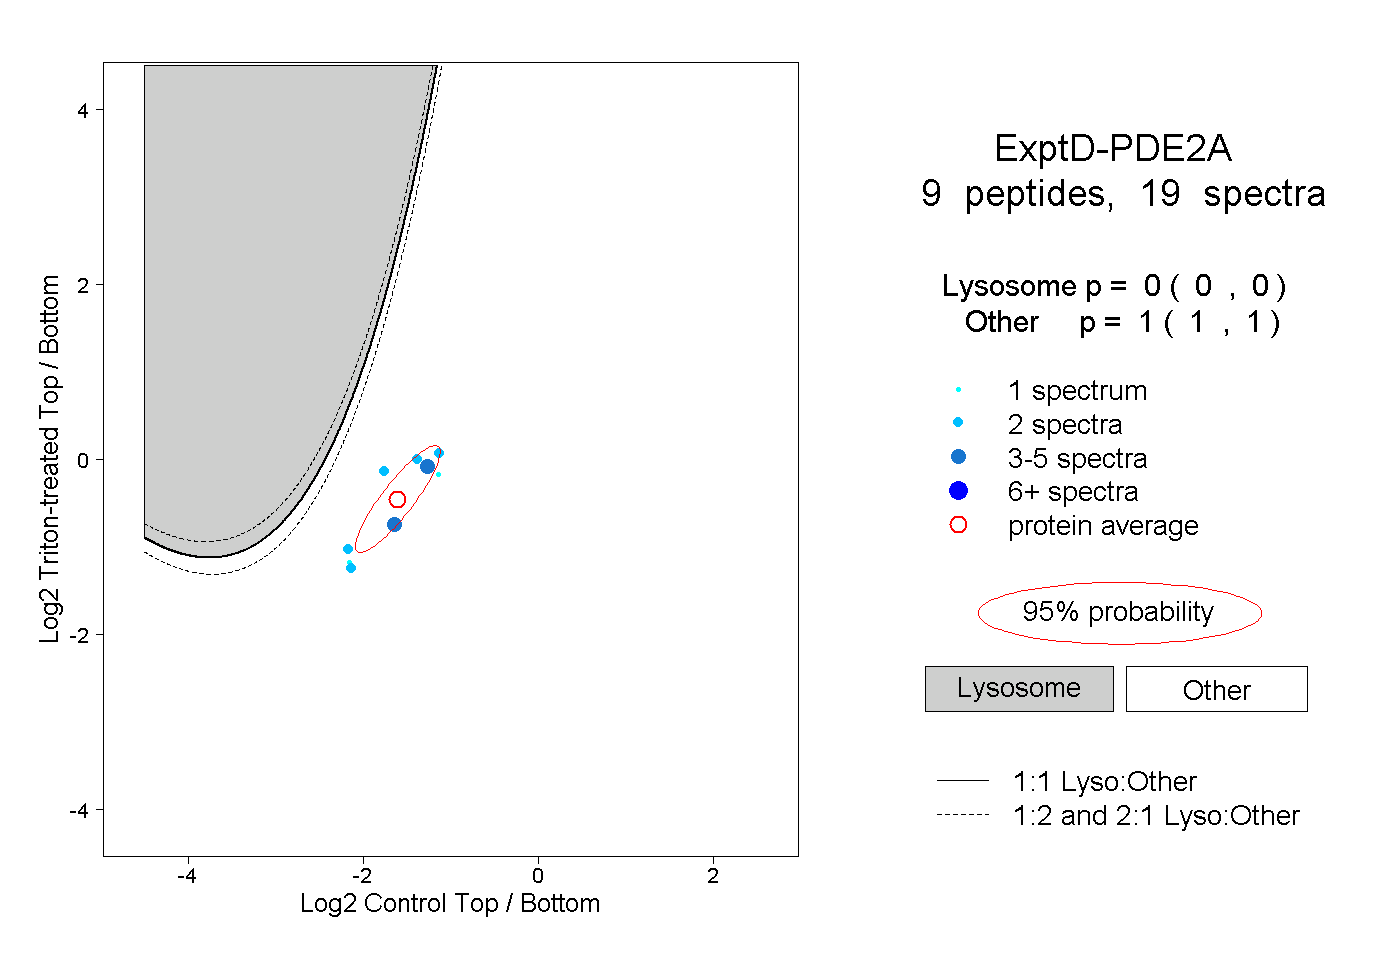
0.000 | 0.000
1.000 | 1.000