 19
19peptides
spectra
0.000 | 0.000
0.131 | 0.150
0.351 | 0.368
0.001 | 0.010
0.000 | 0.000
0.000 | 0.000
0.490 | 0.495
0.000 | 0.000
| Plot | Mito | Lyso | Perox | ER | Golgi | PM | Cytosol | Nucleus | |||||
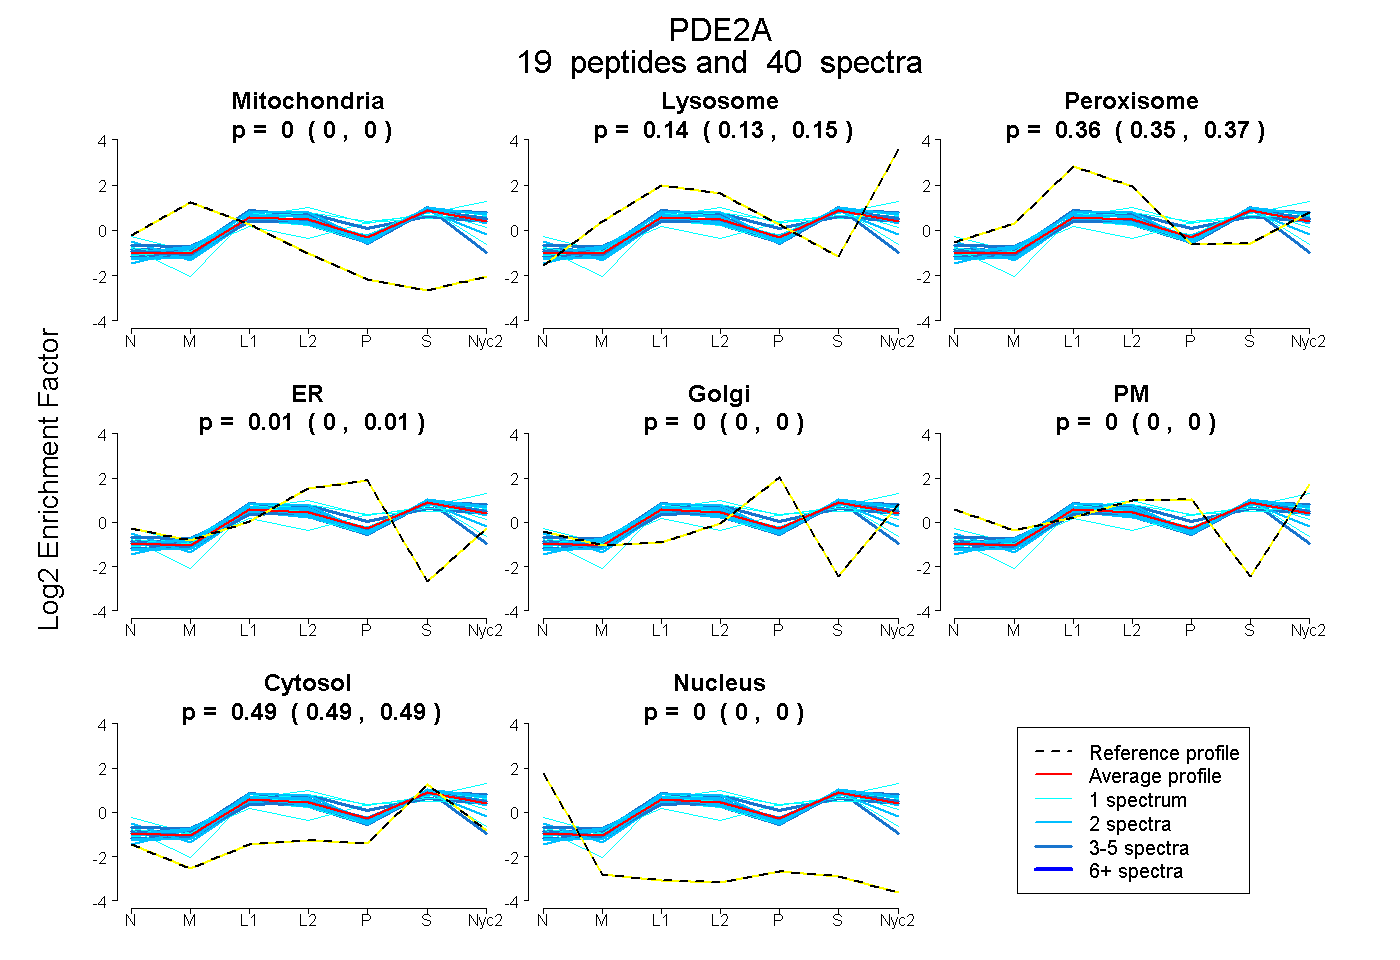
| Expt A |
19 peptides |
40 spectra |
|
0.000 0.000 | 0.000 |
0.141 0.131 | 0.150 |
0.360 0.351 | 0.368 |
0.006 0.001 | 0.010 |
0.000 0.000 | 0.000 |
0.000 0.000 | 0.000 |
0.493 0.490 | 0.495 |
0.000 0.000 | 0.000 |
| 2 spectra, LGGDFFTDEDER | 0.000 | 0.211 | 0.298 | 0.000 | 0.000 | 0.000 | 0.492 | 0.000 | ||
| 2 spectra, GVDDSTGFR | 0.000 | 0.069 | 0.324 | 0.000 | 0.000 | 0.108 | 0.499 | 0.000 | ||
| 4 spectra, AAELYER | 0.000 | 0.182 | 0.387 | 0.000 | 0.000 | 0.000 | 0.431 | 0.000 | ||
| 1 spectrum, LVCEDPPHELPQEGK | 0.000 | 0.000 | 0.359 | 0.076 | 0.000 | 0.000 | 0.565 | 0.000 | ||
| 2 spectra, IDCPTLAR | 0.000 | 0.000 | 0.522 | 0.000 | 0.000 | 0.000 | 0.478 | 0.000 | ||
| 1 spectrum, MLDLMR | 0.000 | 0.194 | 0.282 | 0.135 | 0.000 | 0.000 | 0.388 | 0.000 | ||
| 2 spectra, MAEVGYDR | 0.000 | 0.270 | 0.222 | 0.000 | 0.000 | 0.000 | 0.508 | 0.000 | ||
| 1 spectrum, SVLAALYSSEGSVMER | 0.000 | 0.177 | 0.350 | 0.000 | 0.000 | 0.000 | 0.473 | 0.000 | ||
| 2 spectra, VSDDEYTK | 0.000 | 0.129 | 0.346 | 0.000 | 0.000 | 0.000 | 0.525 | 0.000 | ||
| 2 spectra, VETVYTYLVDGESR | 0.000 | 0.183 | 0.379 | 0.000 | 0.000 | 0.000 | 0.439 | 0.000 | ||
| 1 spectrum, INGPWFSK | 0.000 | 0.389 | 0.162 | 0.061 | 0.000 | 0.000 | 0.388 | 0.000 | ||
| 1 spectrum, GTNNSFQVASK | 0.000 | 0.053 | 0.216 | 0.000 | 0.146 | 0.139 | 0.446 | 0.000 | ||
| 3 spectra, EFFSQGDLEK | 0.000 | 0.168 | 0.303 | 0.000 | 0.000 | 0.000 | 0.528 | 0.000 | ||
| 3 spectra, VQALQQR | 0.000 | 0.183 | 0.295 | 0.011 | 0.000 | 0.000 | 0.510 | 0.000 | ||
| 4 spectra, AMLCVPVISR | 0.000 | 0.000 | 0.406 | 0.016 | 0.000 | 0.000 | 0.578 | 0.000 | ||
| 2 spectra, VLGEEVSFPLTMGR | 0.000 | 0.207 | 0.302 | 0.000 | 0.000 | 0.000 | 0.491 | 0.000 | ||
| 2 spectra, VNEAQYR | 0.000 | 0.206 | 0.298 | 0.000 | 0.000 | 0.000 | 0.496 | 0.000 | ||
| 1 spectrum, DIILATDLAHHLR | 0.000 | 0.037 | 0.412 | 0.000 | 0.000 | 0.014 | 0.538 | 0.000 | ||
| 4 spectra, HALVALQR | 0.000 | 0.100 | 0.388 | 0.067 | 0.053 | 0.000 | 0.391 | 0.000 |
| Plot | Mito | Lyso or Perox | ER | Golgi | PM | Cytosol | Nucleus | ||||||
| Expt B |
3 peptides |
3 spectra |
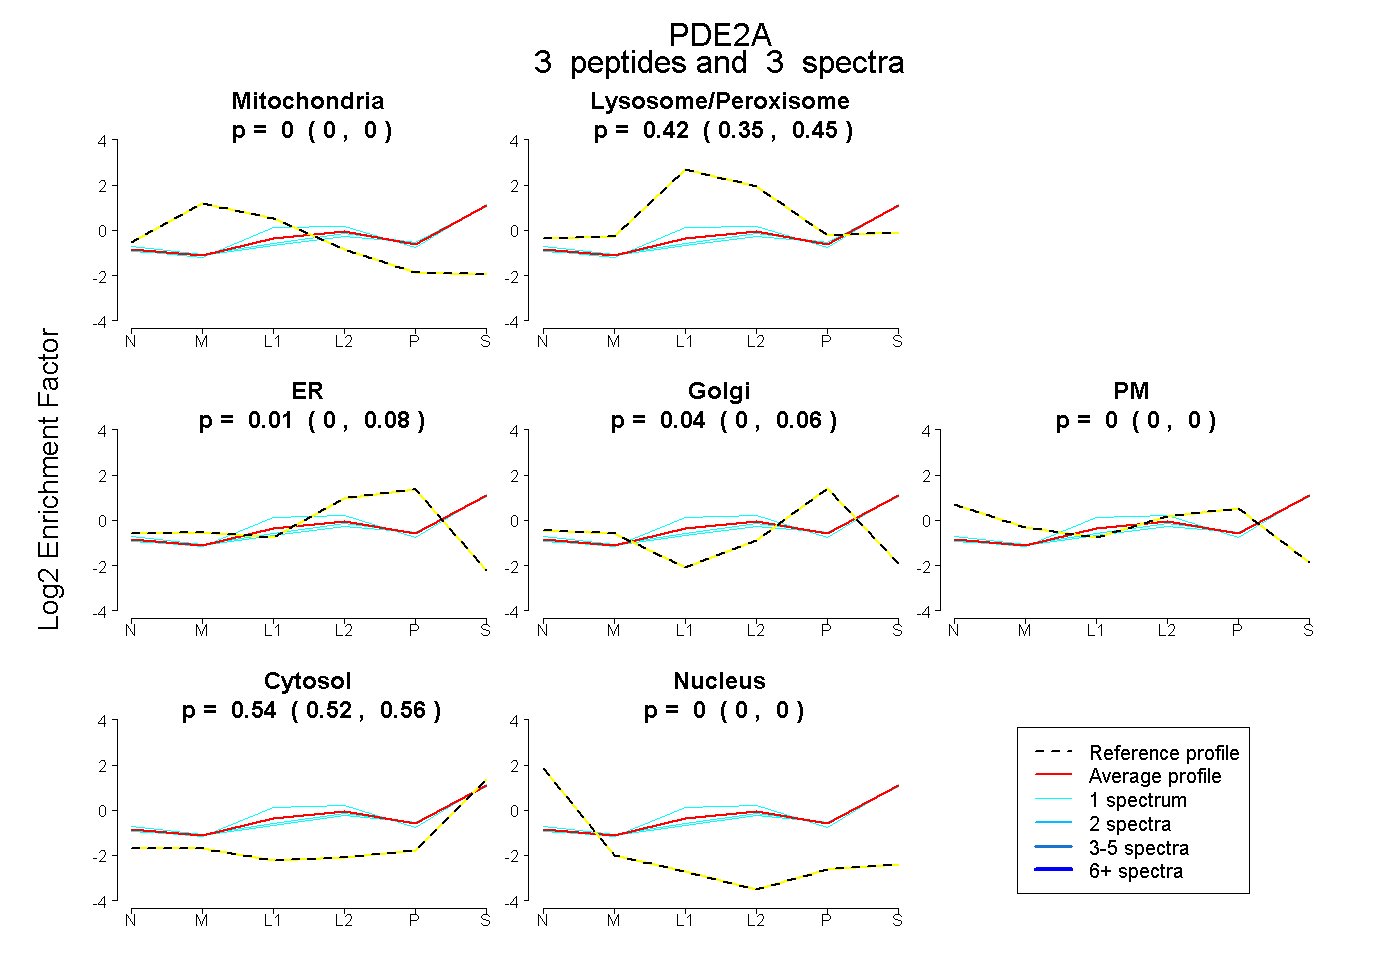 |
0.000 0.000 | 0.000 |
0.418 0.349 | 0.454 |
0.005 0.000 | 0.080 |
0.042 0.000 | 0.059 |
0.000 0.000 | 0.002 |
0.536 0.517 | 0.561 |
0.000 0.000 | 0.000 |
|||
| Plot | Lyso | Other | |||||||||||
| Expt C |
23 peptides |
77 spectra |
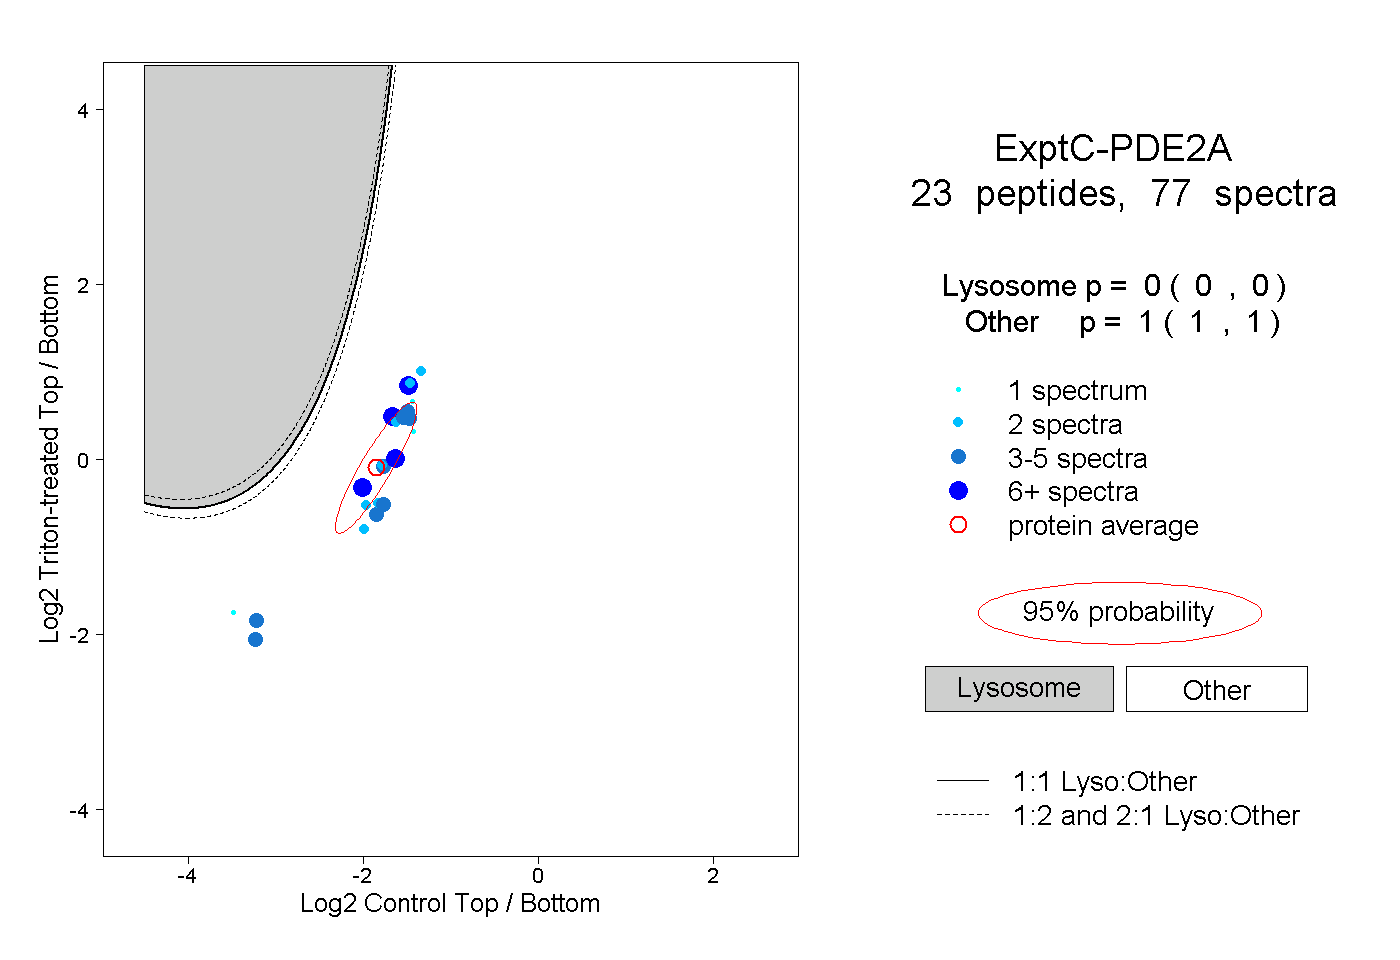 |
0.000 0.000 | 0.000 |
1.000 1.000 | 1.000 |
||||||||
| Plot | Lyso | Other | |||||||||||
| Expt D |
9 peptides |
19 spectra |
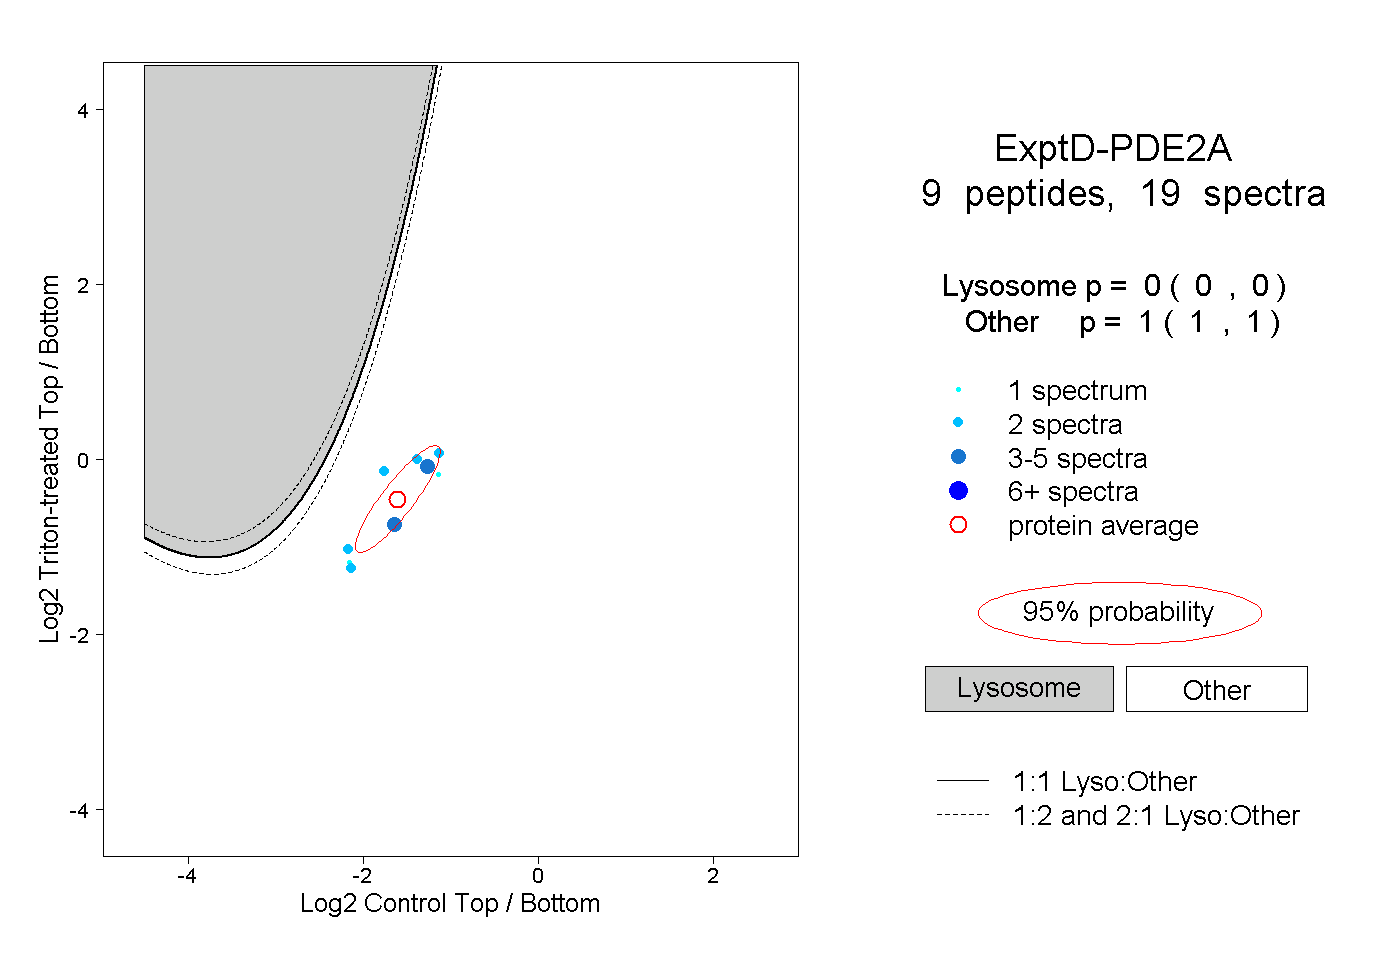 |
0.000 0.000 | 0.000 |
1.000 1.000 | 1.000 |