 6
6peptides
spectra
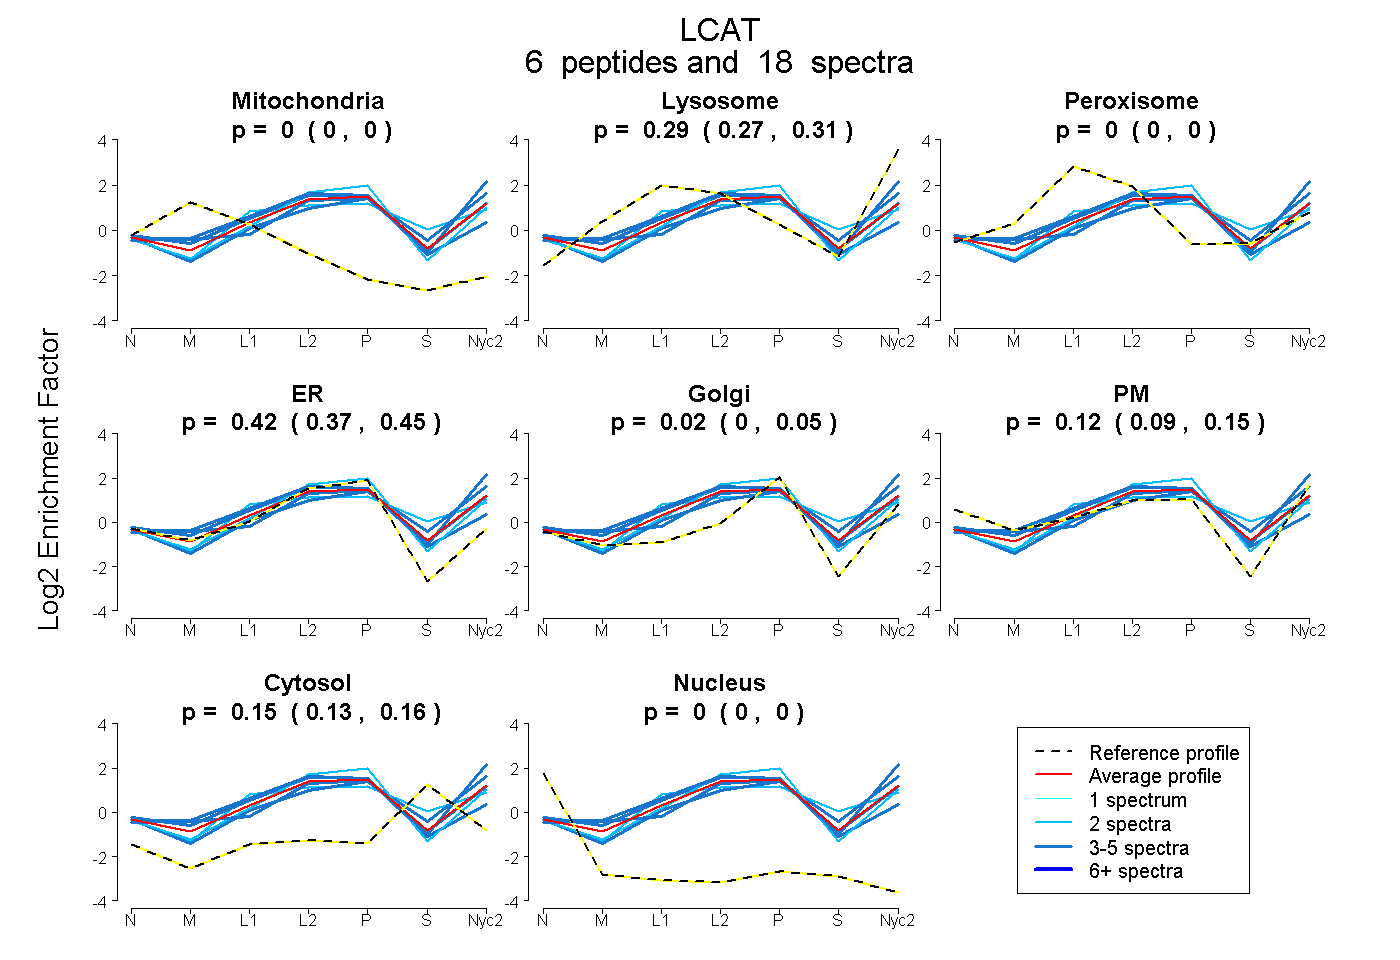
0.000 | 0.000
0.275 | 0.306
0.000 | 0.000
0.371 | 0.452
0.000 | 0.052
0.094 | 0.150
0.134 | 0.156
0.000 | 0.000
2peptides
spectra
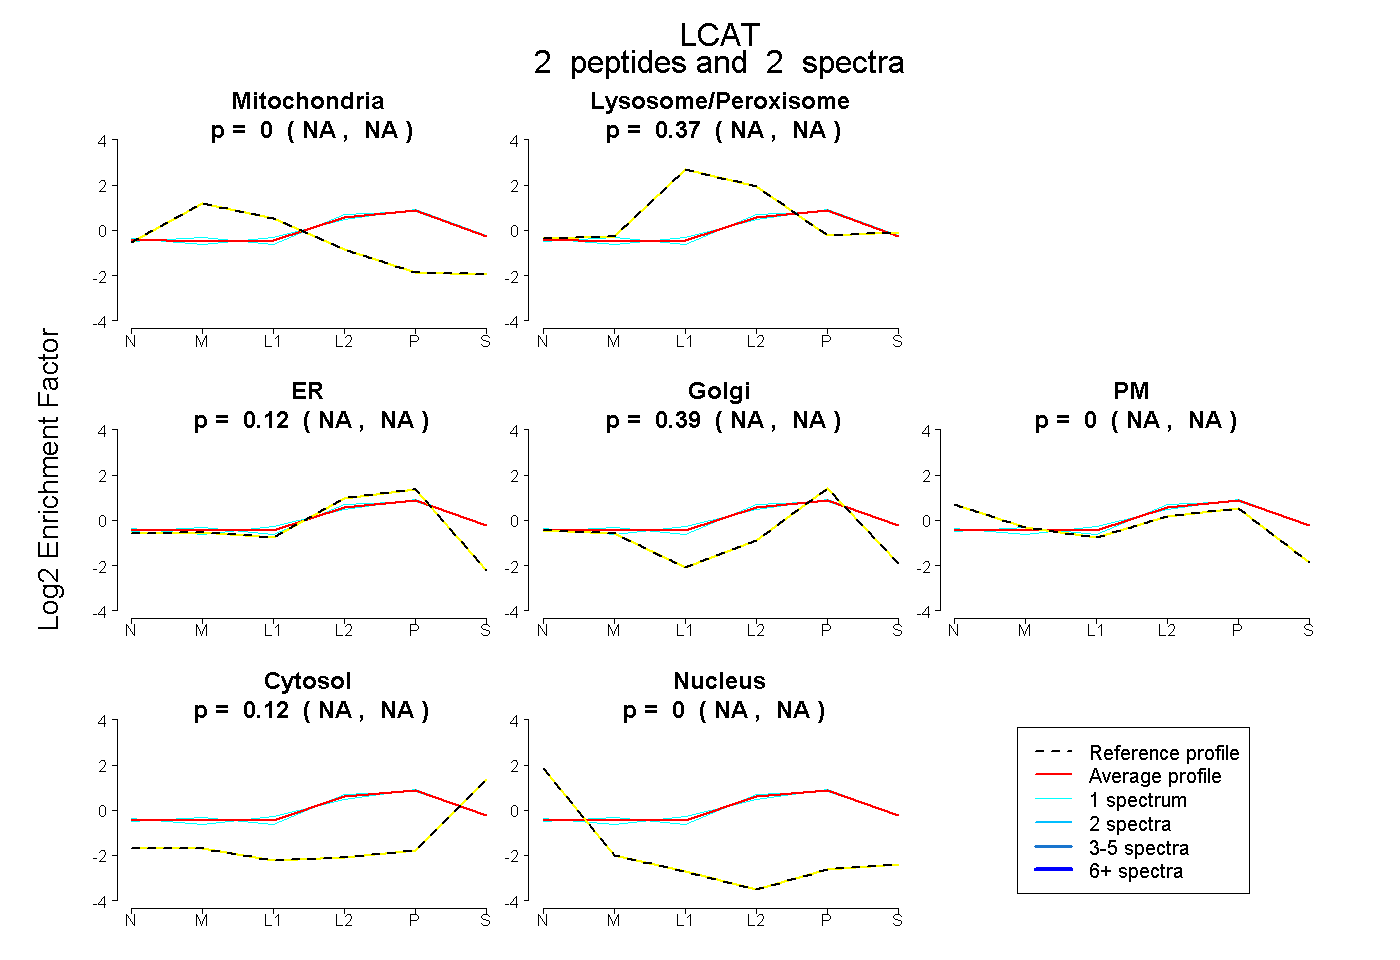
NA | NA
NA | NA
NA | NA
NA | NA
NA | NA
NA | NA
NA | NA
8peptides
spectra
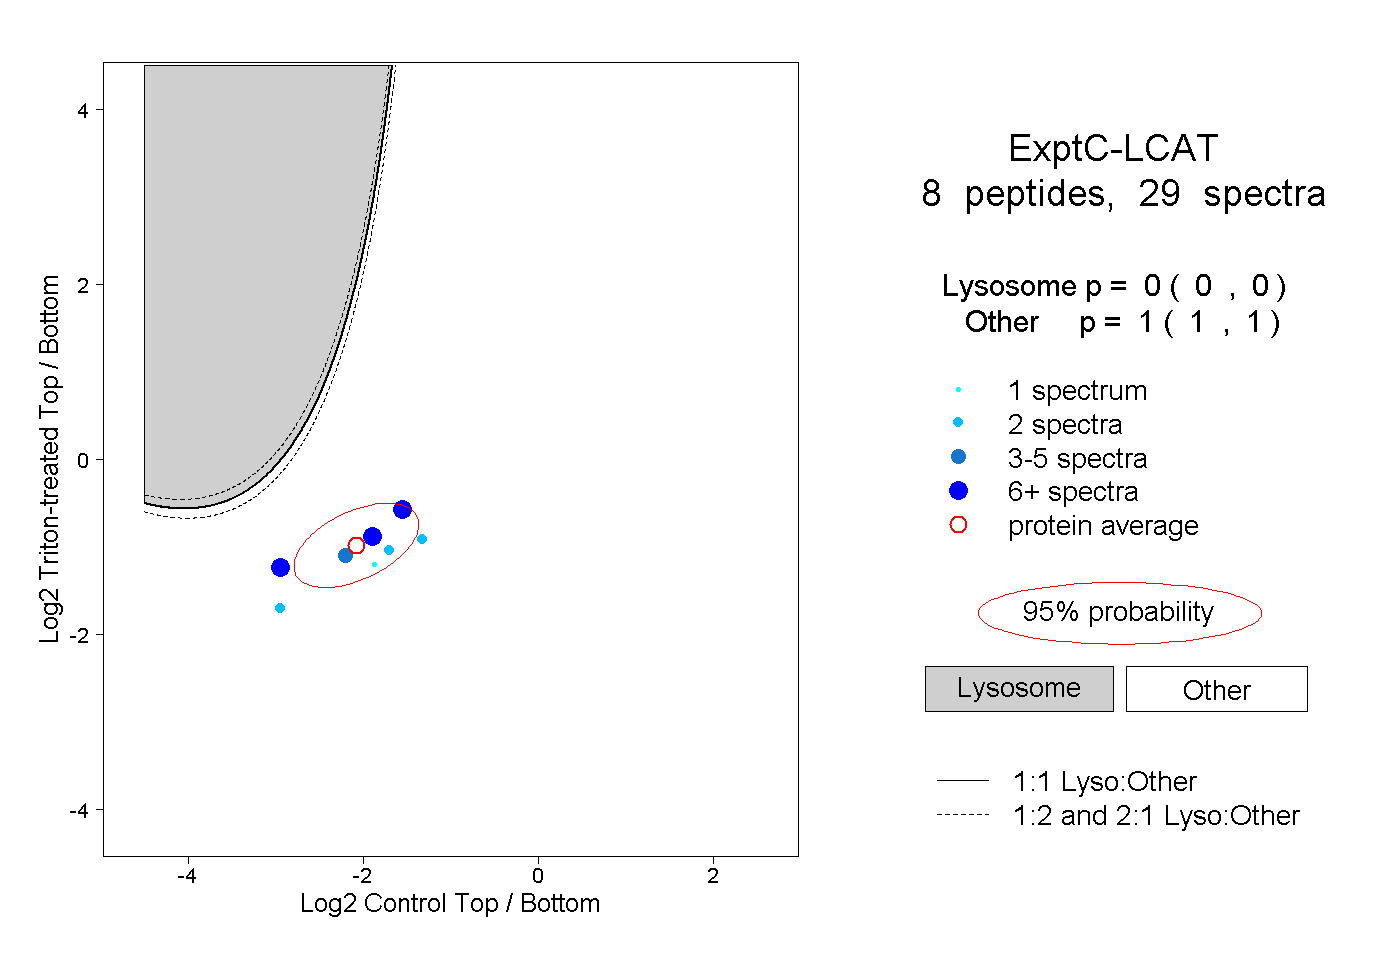
0.000 | 0.000
1.000 | 1.000
1peptide
spectra
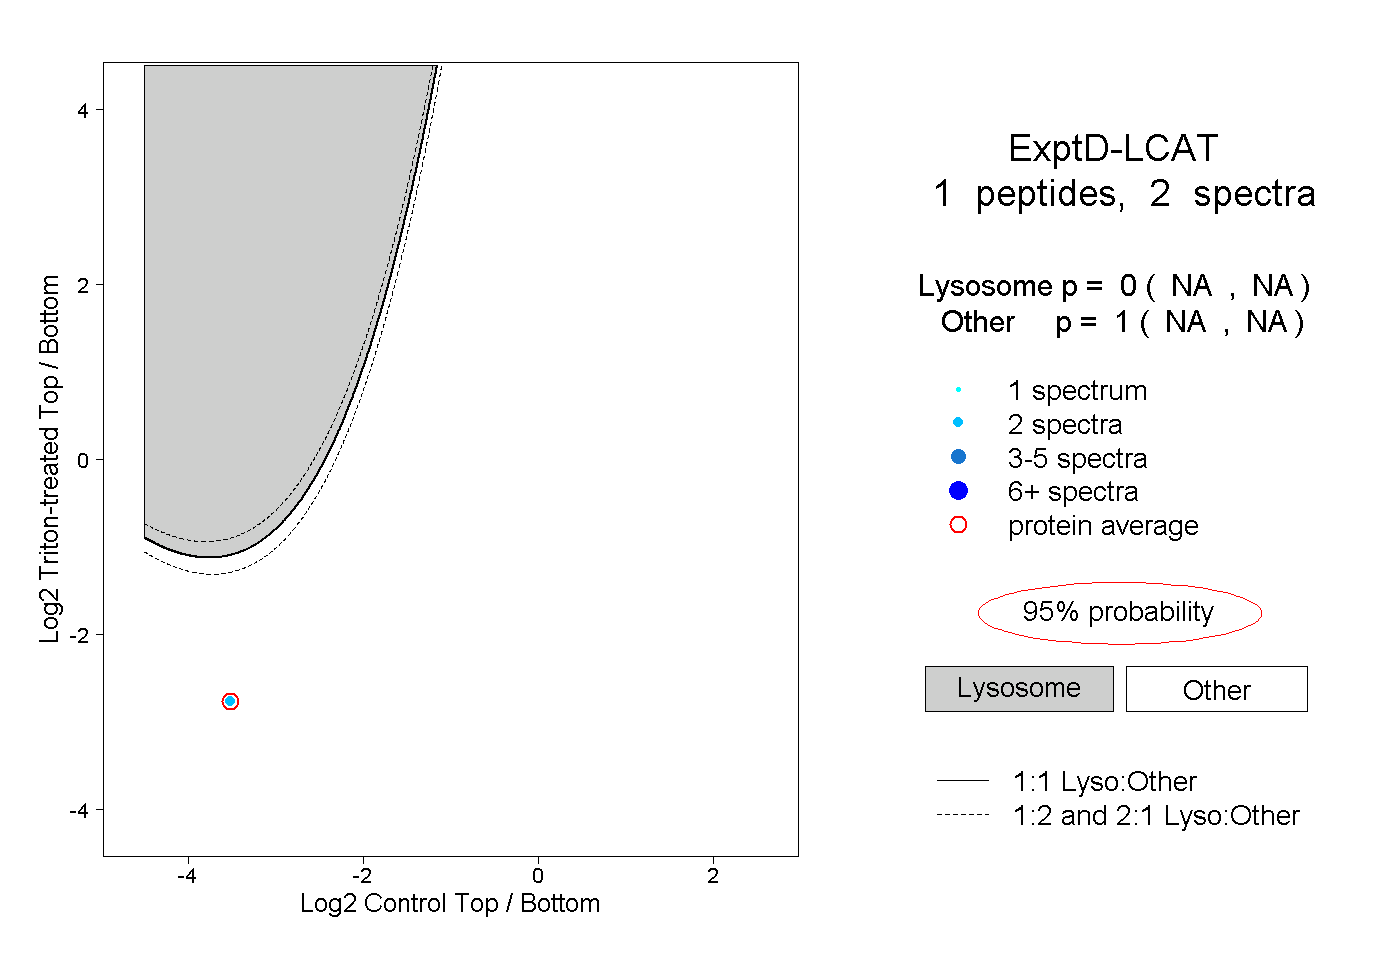
NA | NA
NA | NA