 6
6peptides
spectra
0.000 | 0.000
0.275 | 0.306
0.000 | 0.000
0.371 | 0.452
0.000 | 0.052
0.094 | 0.150
0.134 | 0.156
0.000 | 0.000
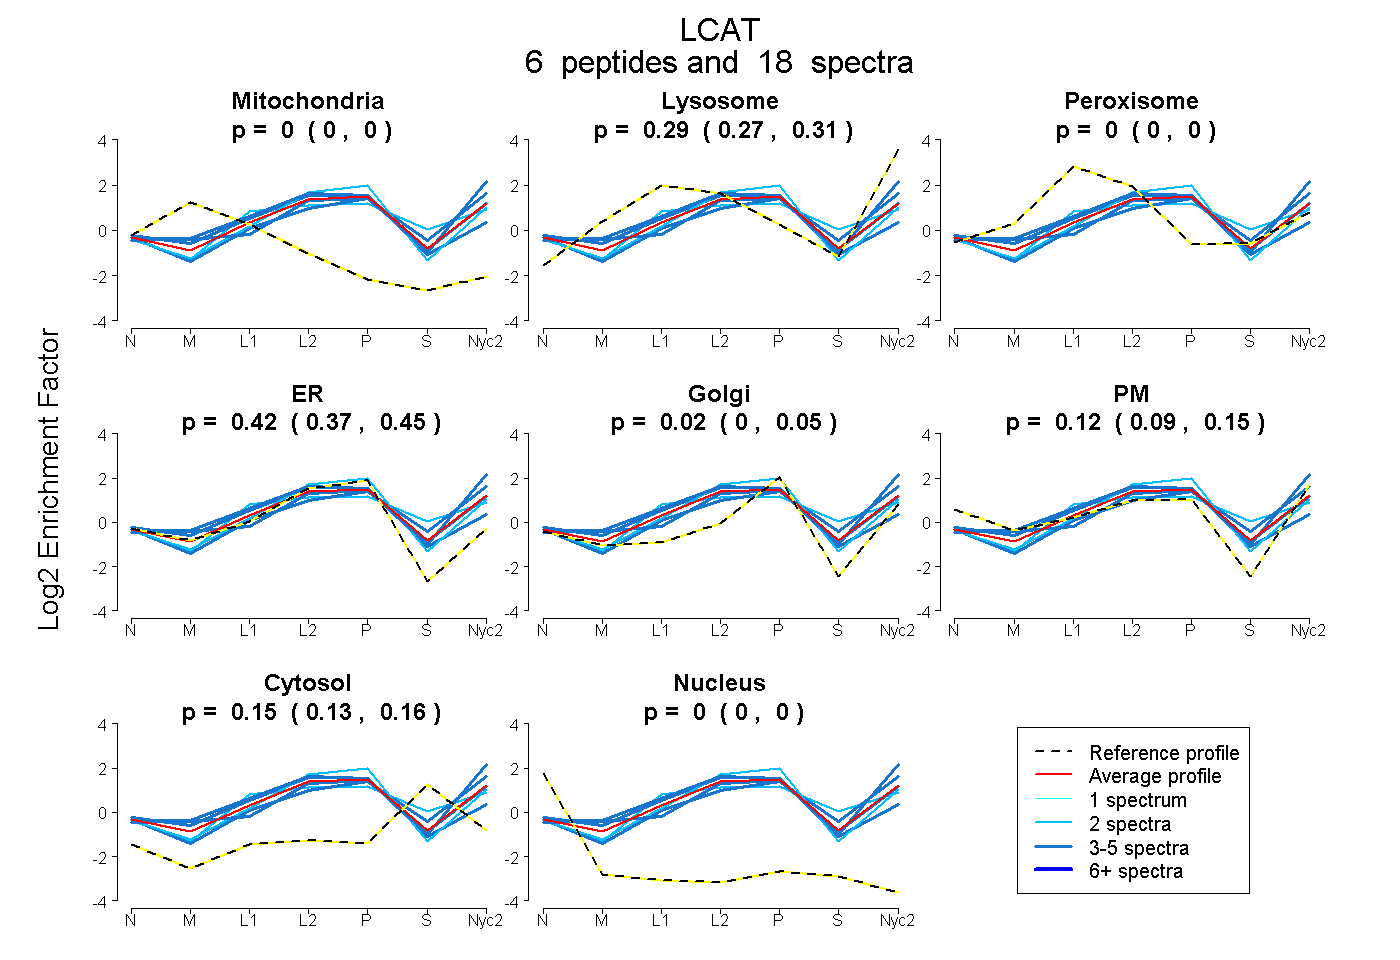
| Plot | Mito | Lyso | Perox | ER | Golgi | PM | Cytosol | Nucleus | |||||
| Expt A |
6 peptides |
18 spectra |
|
0.000 0.000 | 0.000 |
0.292 0.275 | 0.306 |
0.000 0.000 | 0.000 |
0.416 0.371 | 0.452 |
0.021 0.000 | 0.052 |
0.125 0.094 | 0.150 |
0.147 0.134 | 0.156 |
0.000 0.000 | 0.000 |
| 2 spectra, ILASGDNQGIPIMSNIK | 0.000 | 0.207 | 0.209 | 0.269 | 0.075 | 0.000 | 0.241 | 0.000 | ||
| 4 spectra, LDKPNVVNWLCYR | 0.000 | 0.084 | 0.203 | 0.594 | 0.036 | 0.000 | 0.082 | 0.000 | ||
| 3 spectra, TYSVEYLDDNK | 0.000 | 0.471 | 0.000 | 0.217 | 0.130 | 0.159 | 0.024 | 0.000 | ||
| 4 spectra, TLEHINAILLGAYR | 0.000 | 0.247 | 0.000 | 0.320 | 0.116 | 0.177 | 0.139 | 0.000 | ||
| 3 spectra, QQDEYYQK | 0.000 | 0.286 | 0.000 | 0.093 | 0.228 | 0.183 | 0.210 | 0.000 | ||
| 2 spectra, STELCGQWQGR | 0.000 | 0.232 | 0.000 | 0.584 | 0.124 | 0.000 | 0.061 | 0.000 |
| Plot | Mito | Lyso or Perox | ER | Golgi | PM | Cytosol | Nucleus | ||||||
| Expt B |
2 peptides |
2 spectra |
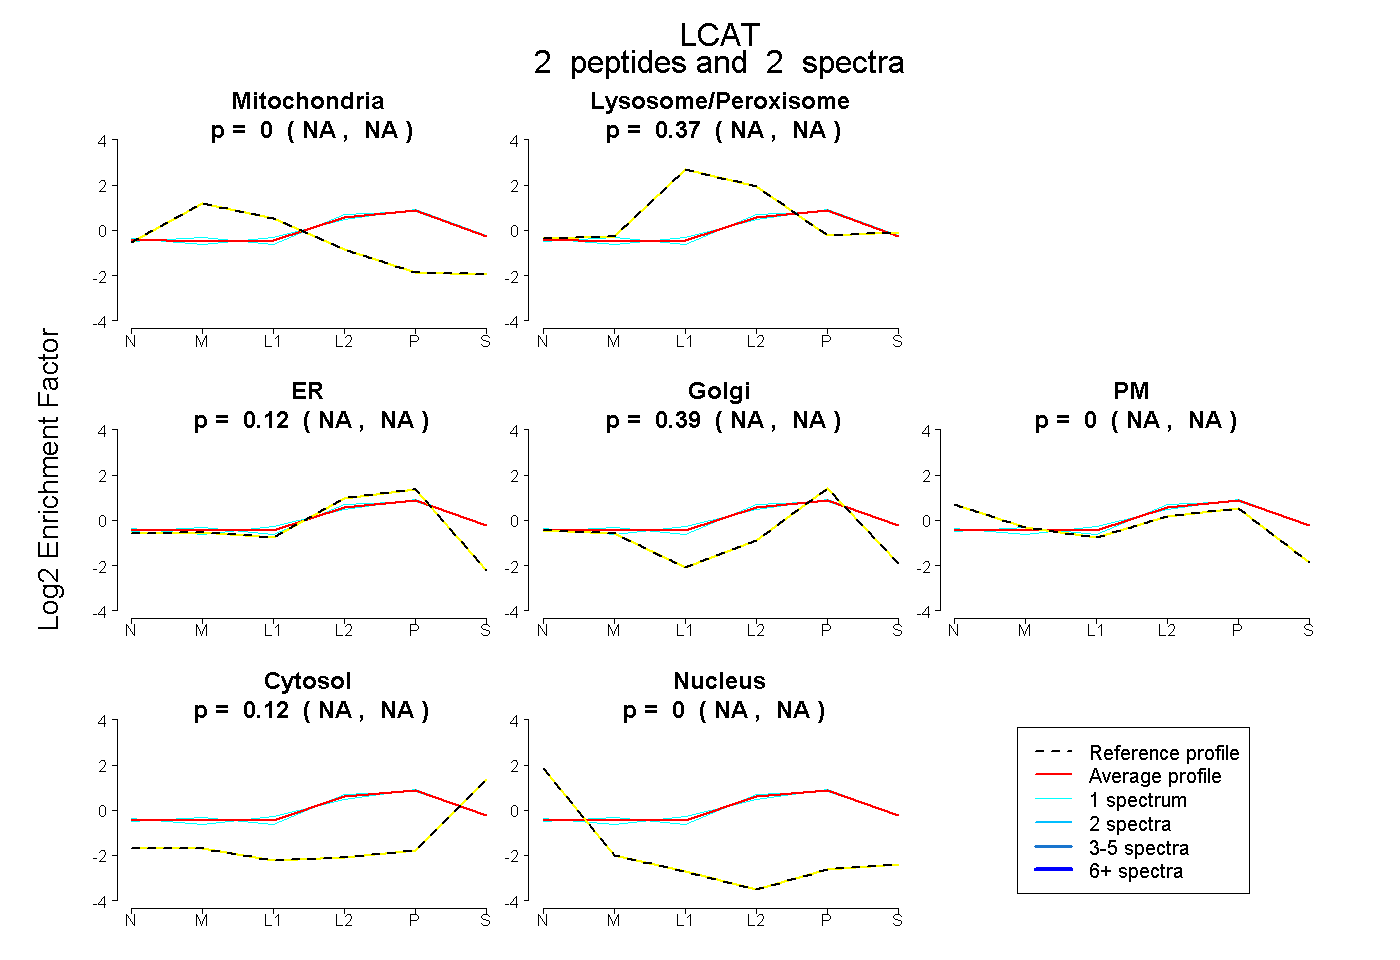 |
0.000 NA | NA |
0.372 NA | NA |
0.124 NA | NA |
0.388 NA | NA |
0.000 NA | NA |
0.116 NA | NA |
0.000 NA | NA |
|||
| Plot | Lyso | Other | |||||||||||
| Expt C |
8 peptides |
29 spectra |
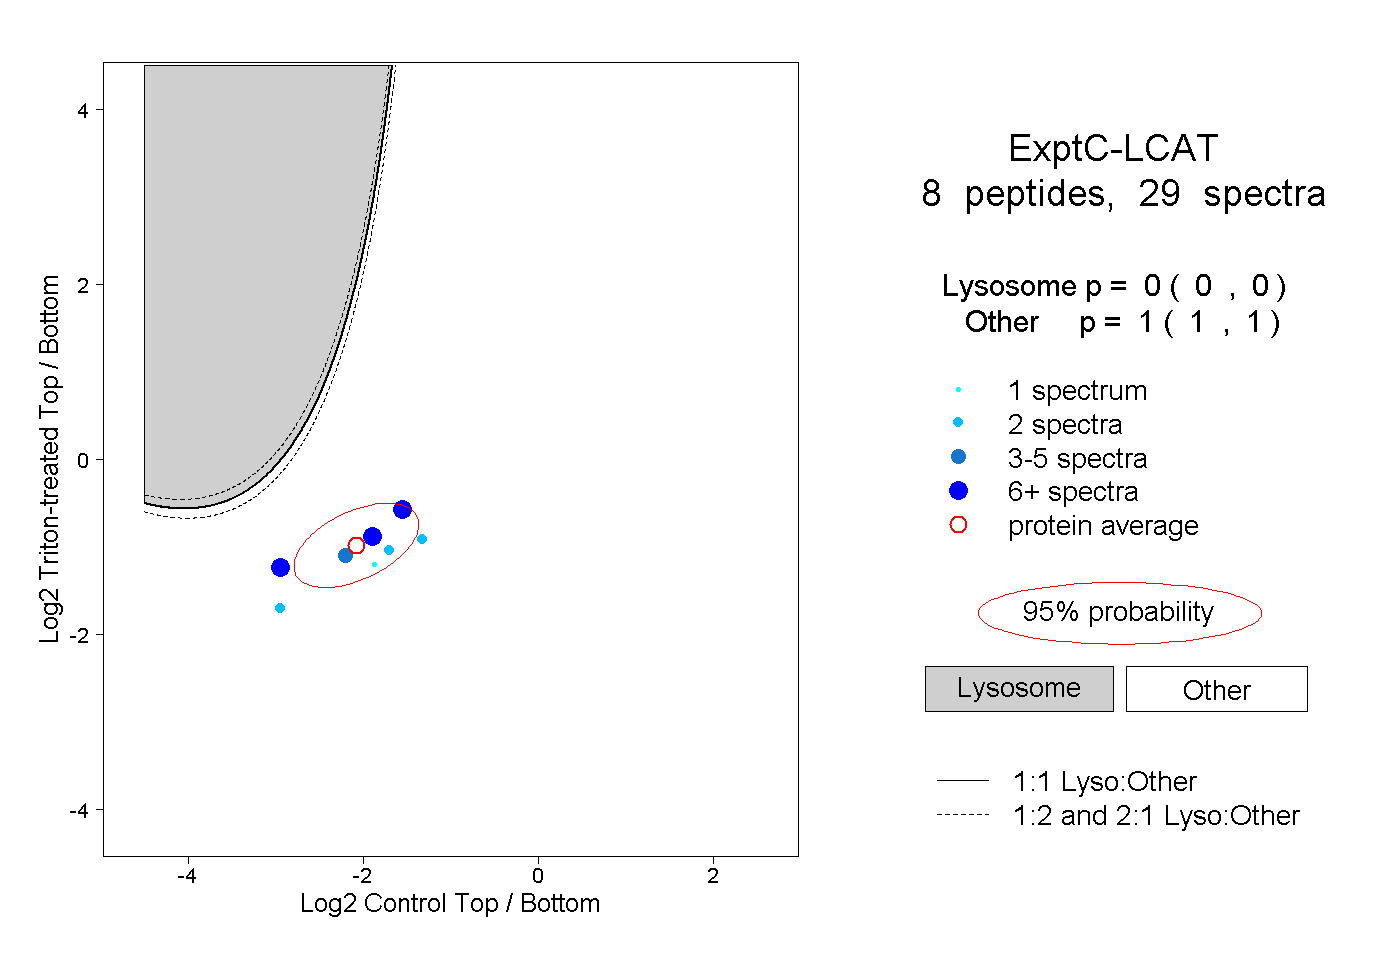 |
0.000 0.000 | 0.000 |
1.000 1.000 | 1.000 |
||||||||
| Plot | Lyso | Other | |||||||||||
| Expt D |
1 peptide |
2 spectra |
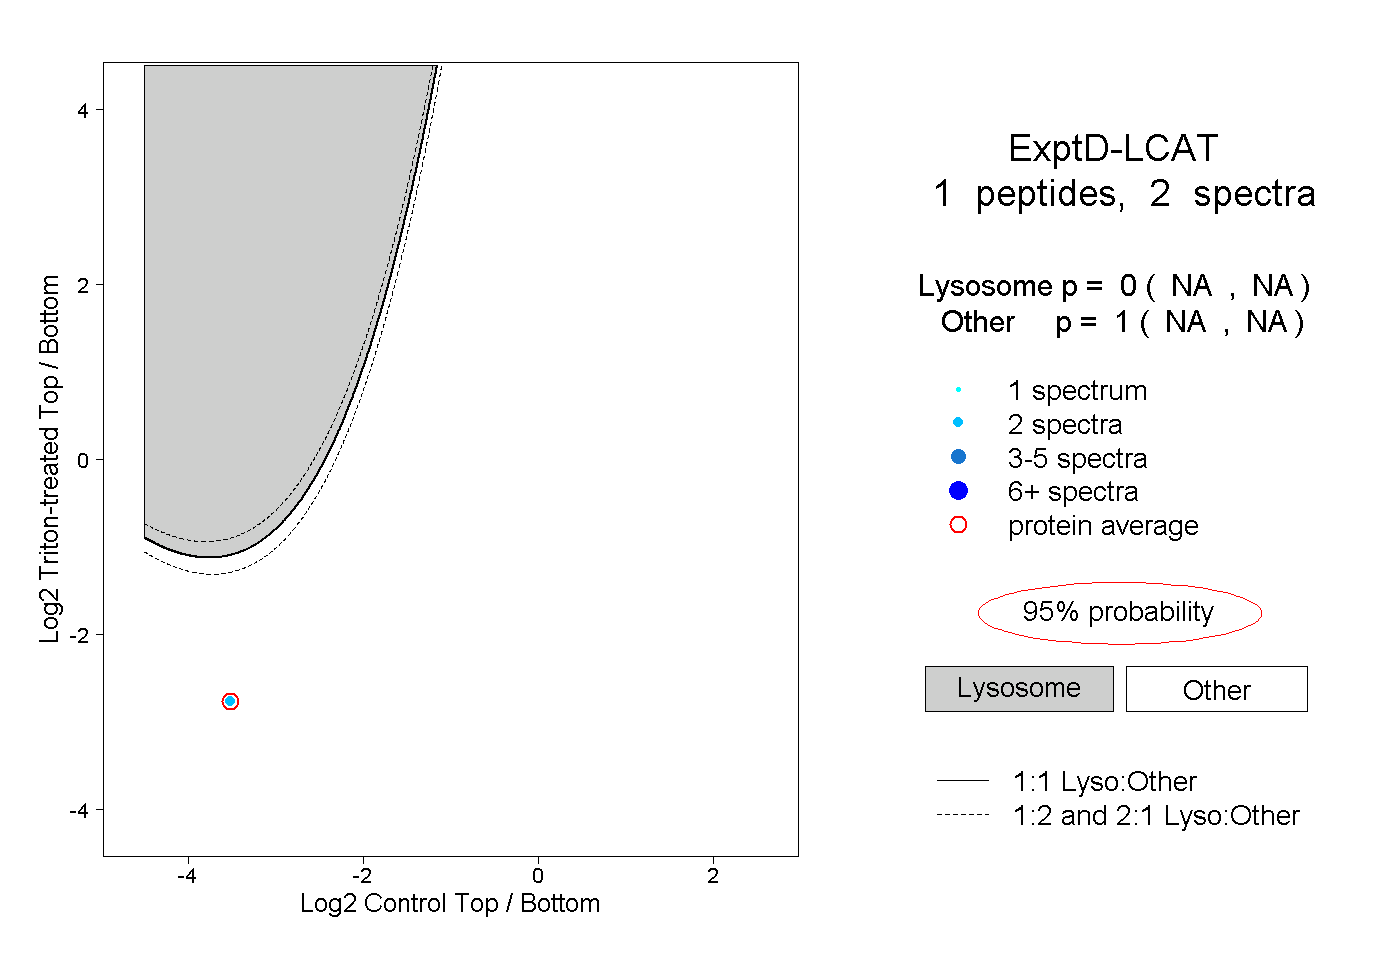 |
0.000 NA | NA |
1.000 NA | NA |