 9
9peptides
spectra
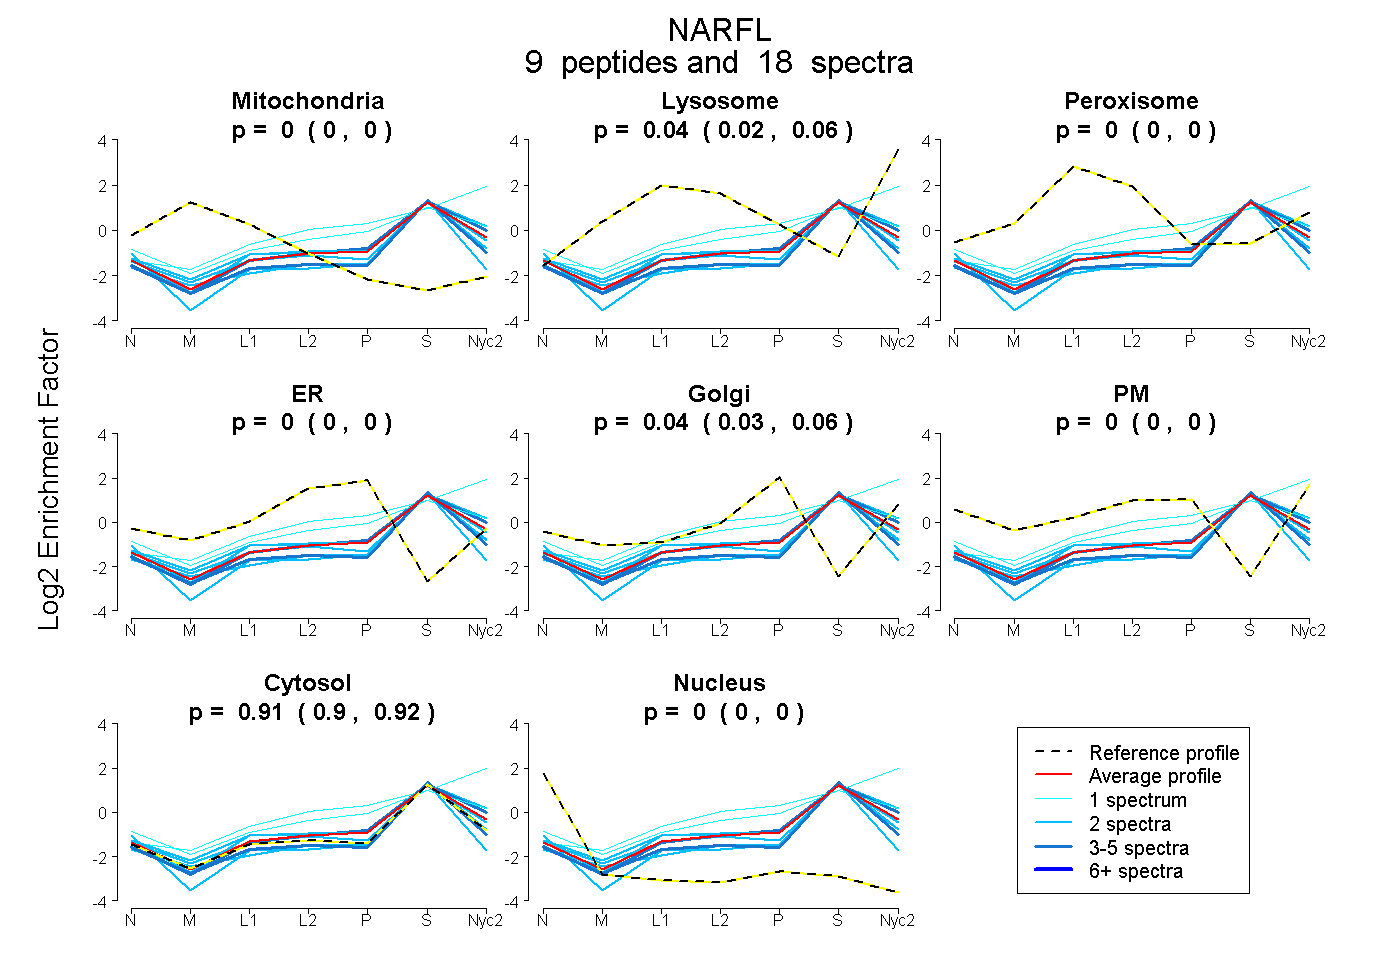
0.000 | 0.000
0.022 | 0.060
0.000 | 0.000
0.000 | 0.000
0.026 | 0.059
0.000 | 0.000
0.898 | 0.924
0.000 | 0.000
5peptides
spectra
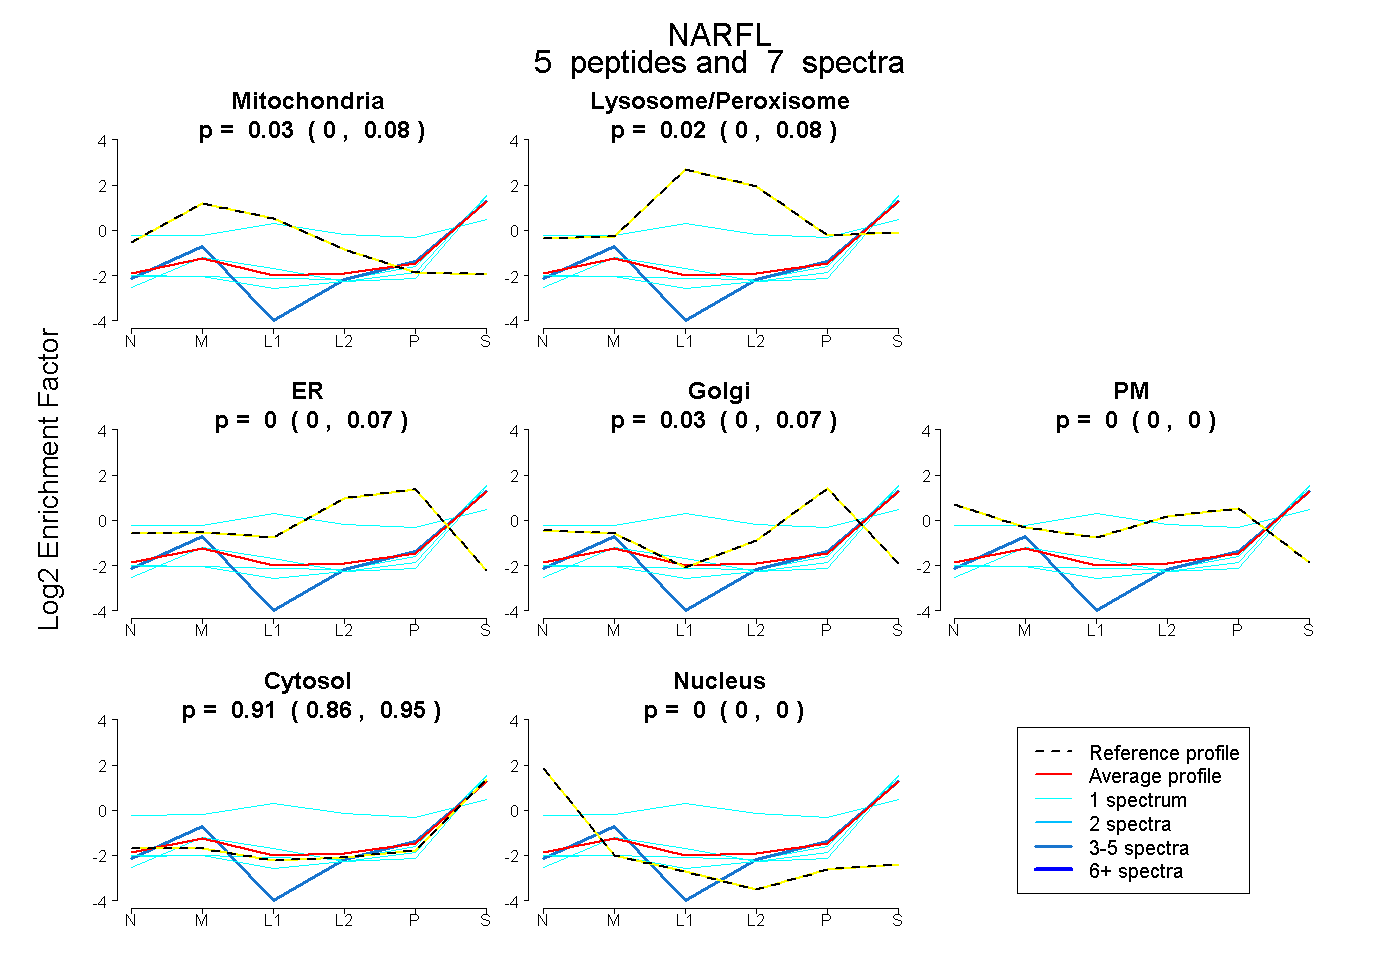
0.000 | 0.081
0.000 | 0.080
0.000 | 0.065
0.000 | 0.073
0.000 | 0.000
0.861 | 0.952
0.000 | 0.000
6peptides
spectra
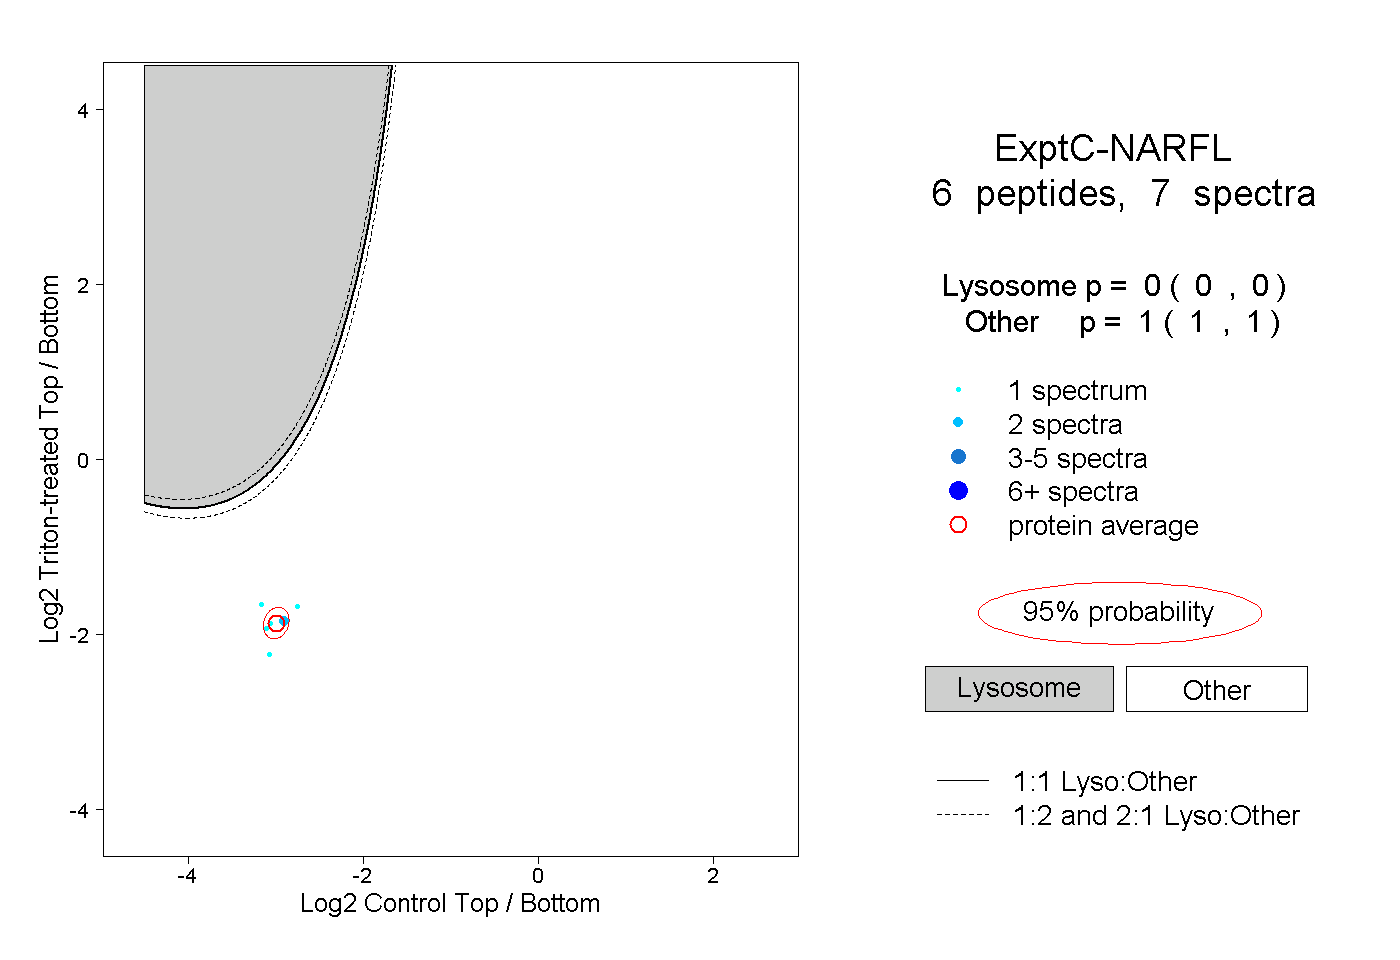
0.000 | 0.000
1.000 | 1.000
2peptides
spectra
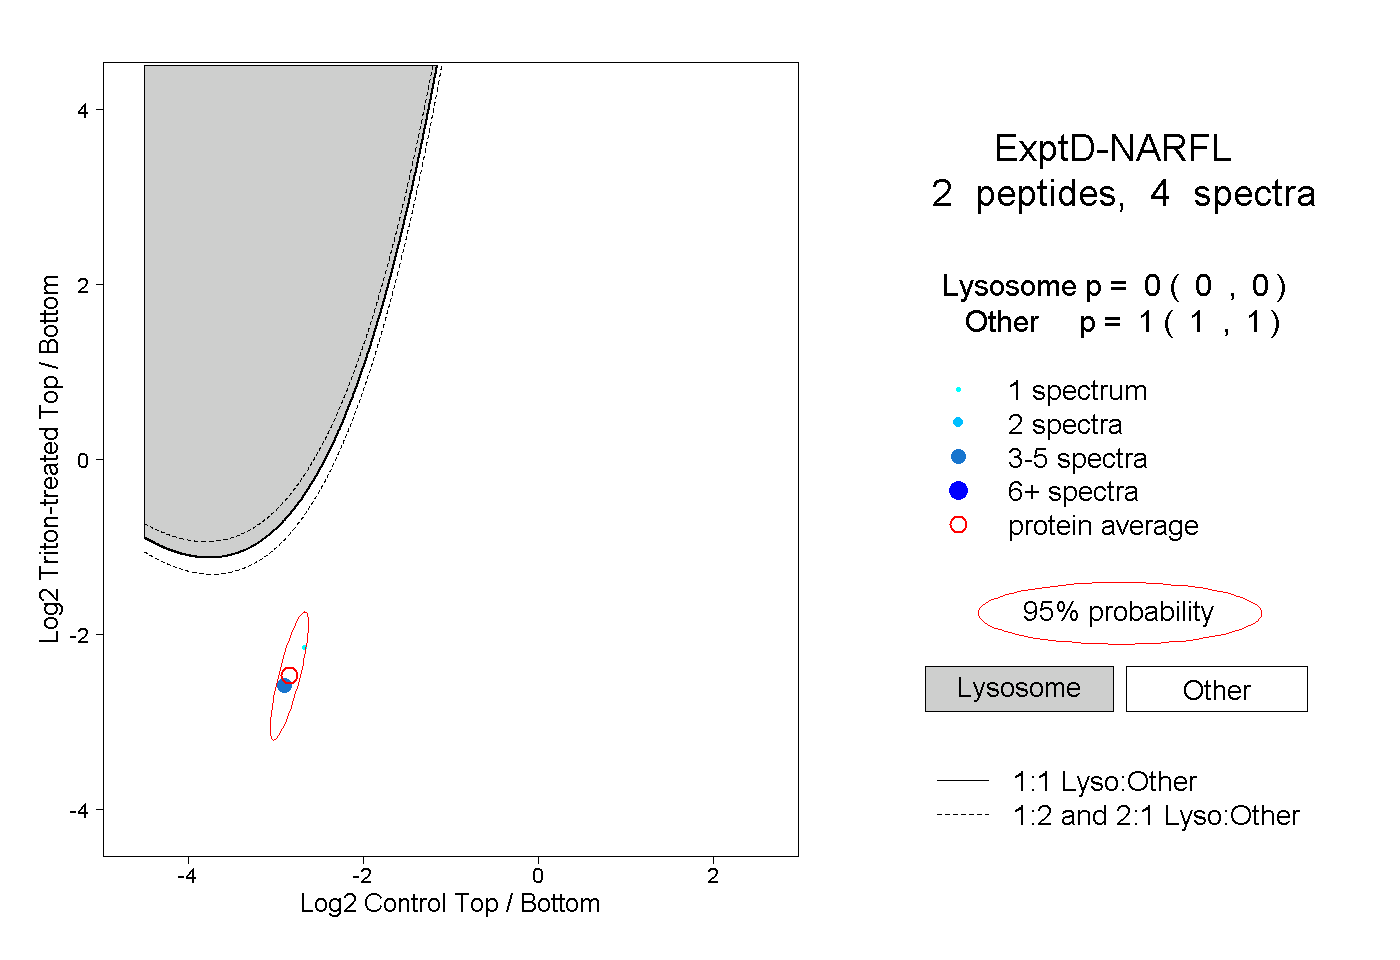
0.000 | 0.000
1.000 | 1.000