 9
9peptides
spectra
0.000 | 0.000
0.022 | 0.060
0.000 | 0.000
0.000 | 0.000
0.026 | 0.059
0.000 | 0.000
0.898 | 0.924
0.000 | 0.000
| Plot | Mito | Lyso | Perox | ER | Golgi | PM | Cytosol | Nucleus | |||||
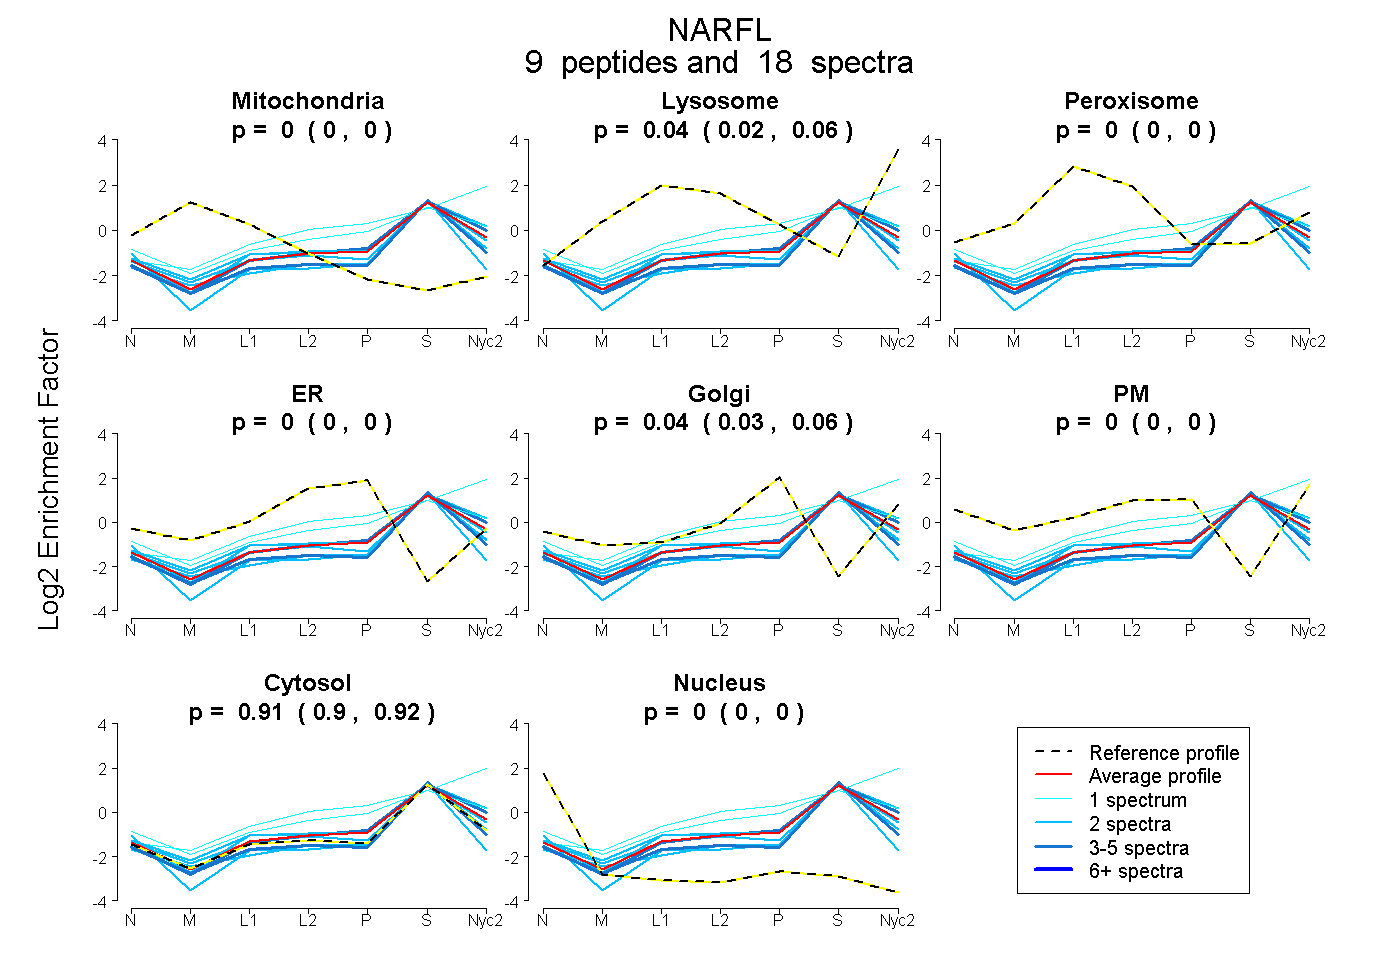
| Expt A |
9 peptides |
18 spectra |
|
0.000 0.000 | 0.000 |
0.044 0.022 | 0.060 |
0.000 0.000 | 0.000 |
0.000 0.000 | 0.000 |
0.045 0.026 | 0.059 |
0.000 0.000 | 0.000 |
0.911 0.898 | 0.924 |
0.000 0.000 | 0.000 |
| 3 spectra, FQLDSTDTAR | 0.000 | 0.068 | 0.000 | 0.000 | 0.027 | 0.000 | 0.904 | 0.000 | ||
| 3 spectra, VAAPGQQR | 0.000 | 0.000 | 0.000 | 0.000 | 0.000 | 0.000 | 0.985 | 0.015 | ||
| 2 spectra, DVDCVLTTGEVFR | 0.000 | 0.000 | 0.000 | 0.000 | 0.000 | 0.000 | 0.879 | 0.121 | ||
| 2 spectra, DFQEVTLER | 0.000 | 0.000 | 0.000 | 0.000 | 0.000 | 0.000 | 0.996 | 0.004 | ||
| 2 spectra, APDTEGR | 0.000 | 0.060 | 0.000 | 0.000 | 0.000 | 0.000 | 0.940 | 0.000 | ||
| 1 spectrum, INSGLSIR | 0.000 | 0.127 | 0.000 | 0.011 | 0.119 | 0.050 | 0.692 | 0.000 | ||
| 2 spectra, SPQQVMGSLIK | 0.000 | 0.000 | 0.064 | 0.049 | 0.000 | 0.000 | 0.887 | 0.000 | ||
| 1 spectrum, KPGSGIAK | 0.000 | 0.399 | 0.000 | 0.000 | 0.063 | 0.000 | 0.538 | 0.000 | ||
| 2 spectra, EGQVLLR | 0.000 | 0.119 | 0.000 | 0.000 | 0.000 | 0.000 | 0.881 | 0.000 |
| Plot | Mito | Lyso or Perox | ER | Golgi | PM | Cytosol | Nucleus | ||||||
| Expt B |
5 peptides |
7 spectra |
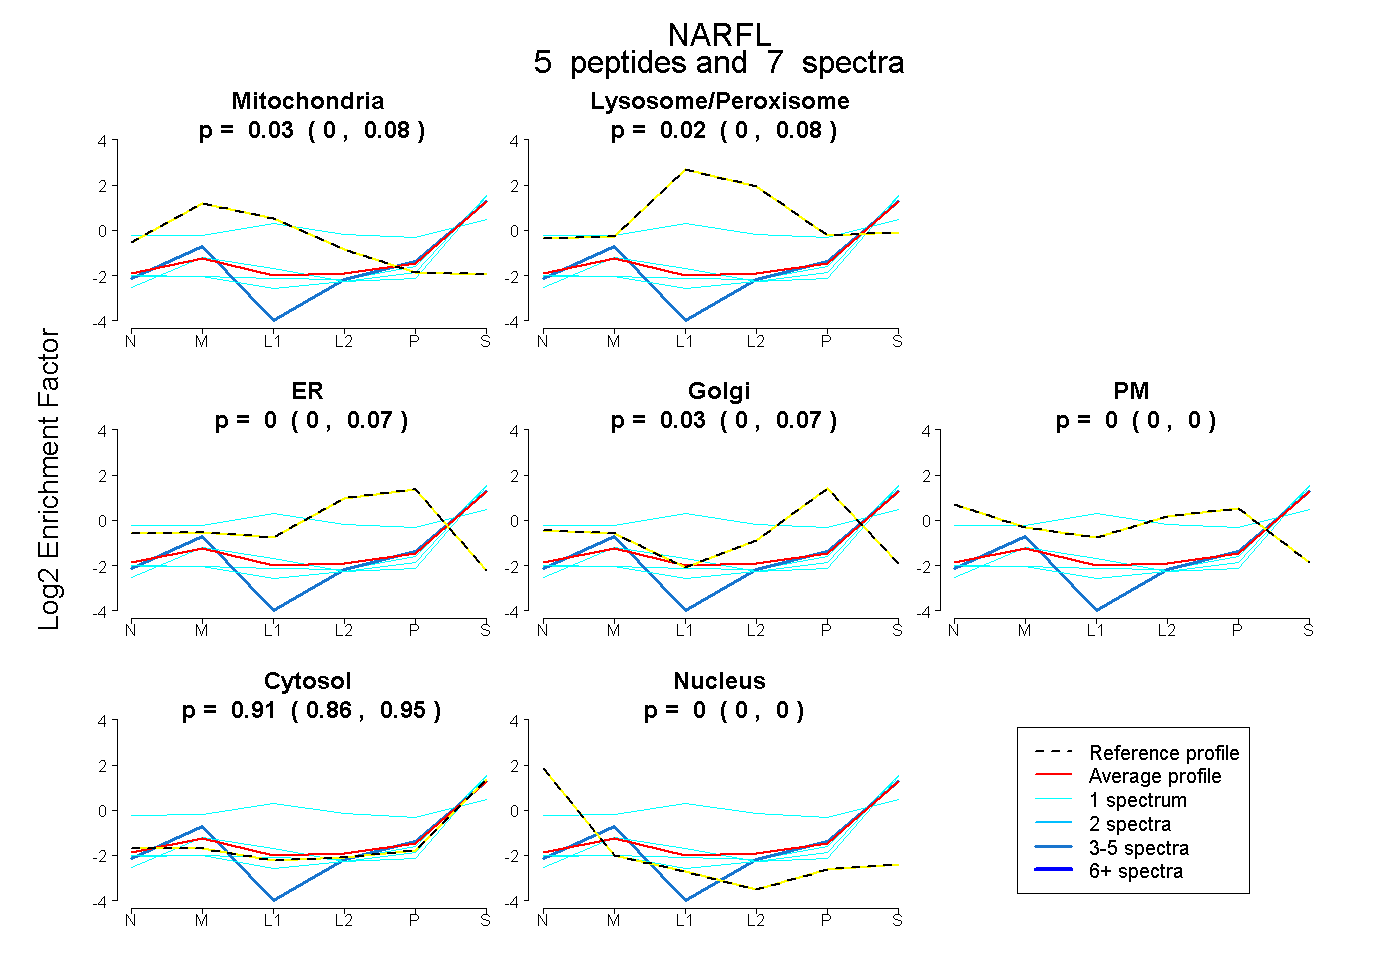 |
0.032 0.000 | 0.081 |
0.025 0.000 | 0.080 |
0.000 0.000 | 0.065 |
0.033 0.000 | 0.073 |
0.000 0.000 | 0.000 |
0.911 0.861 | 0.952 |
0.000 0.000 | 0.000 |
|||
| Plot | Lyso | Other | |||||||||||
| Expt C |
6 peptides |
7 spectra |
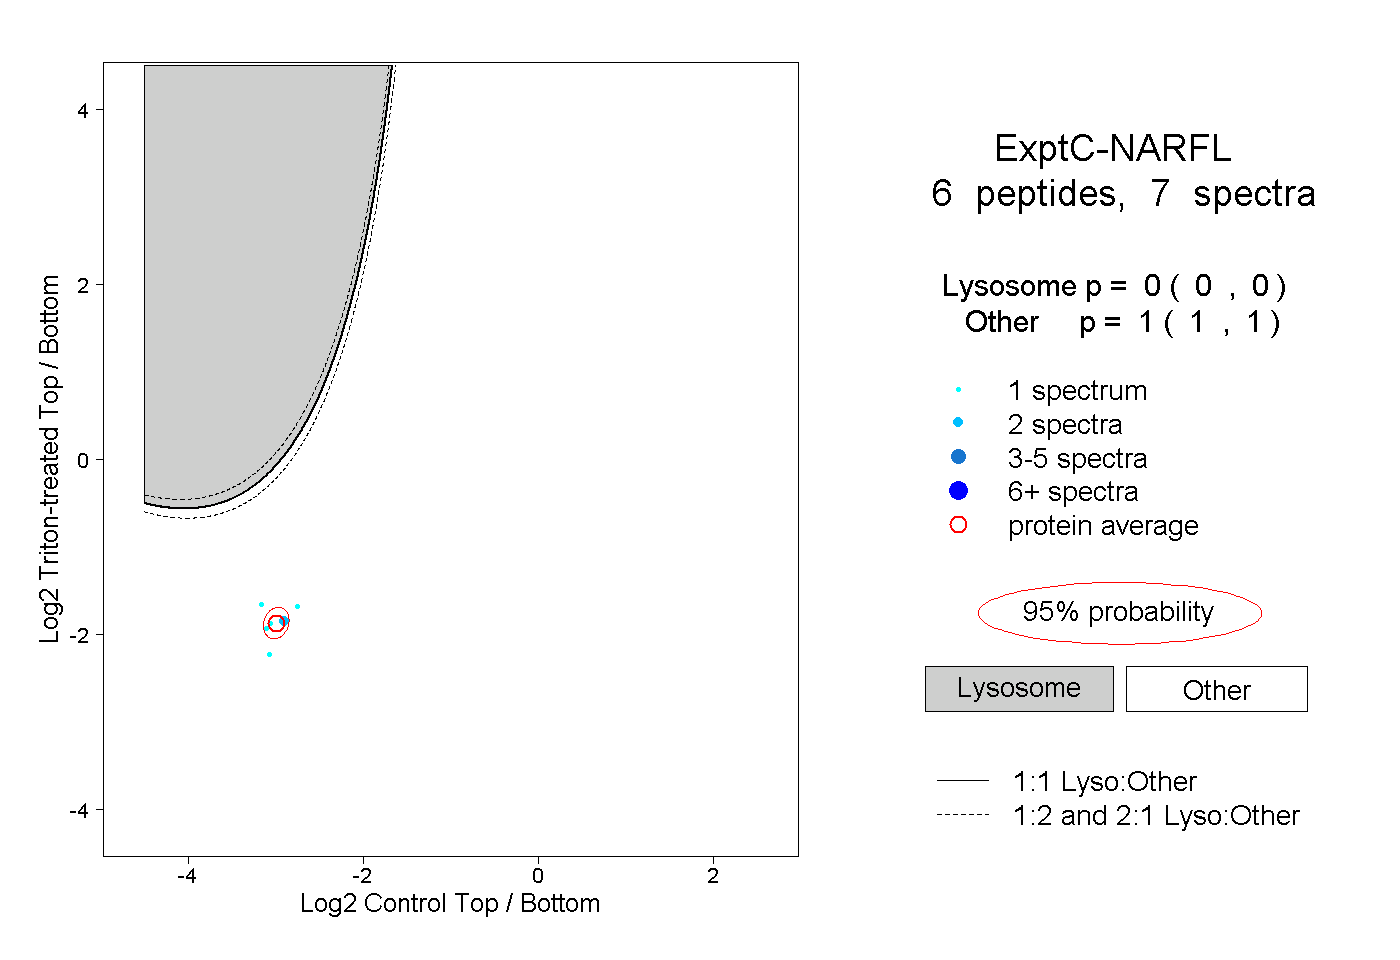 |
0.000 0.000 | 0.000 |
1.000 1.000 | 1.000 |
||||||||
| Plot | Lyso | Other | |||||||||||
| Expt D |
2 peptides |
4 spectra |
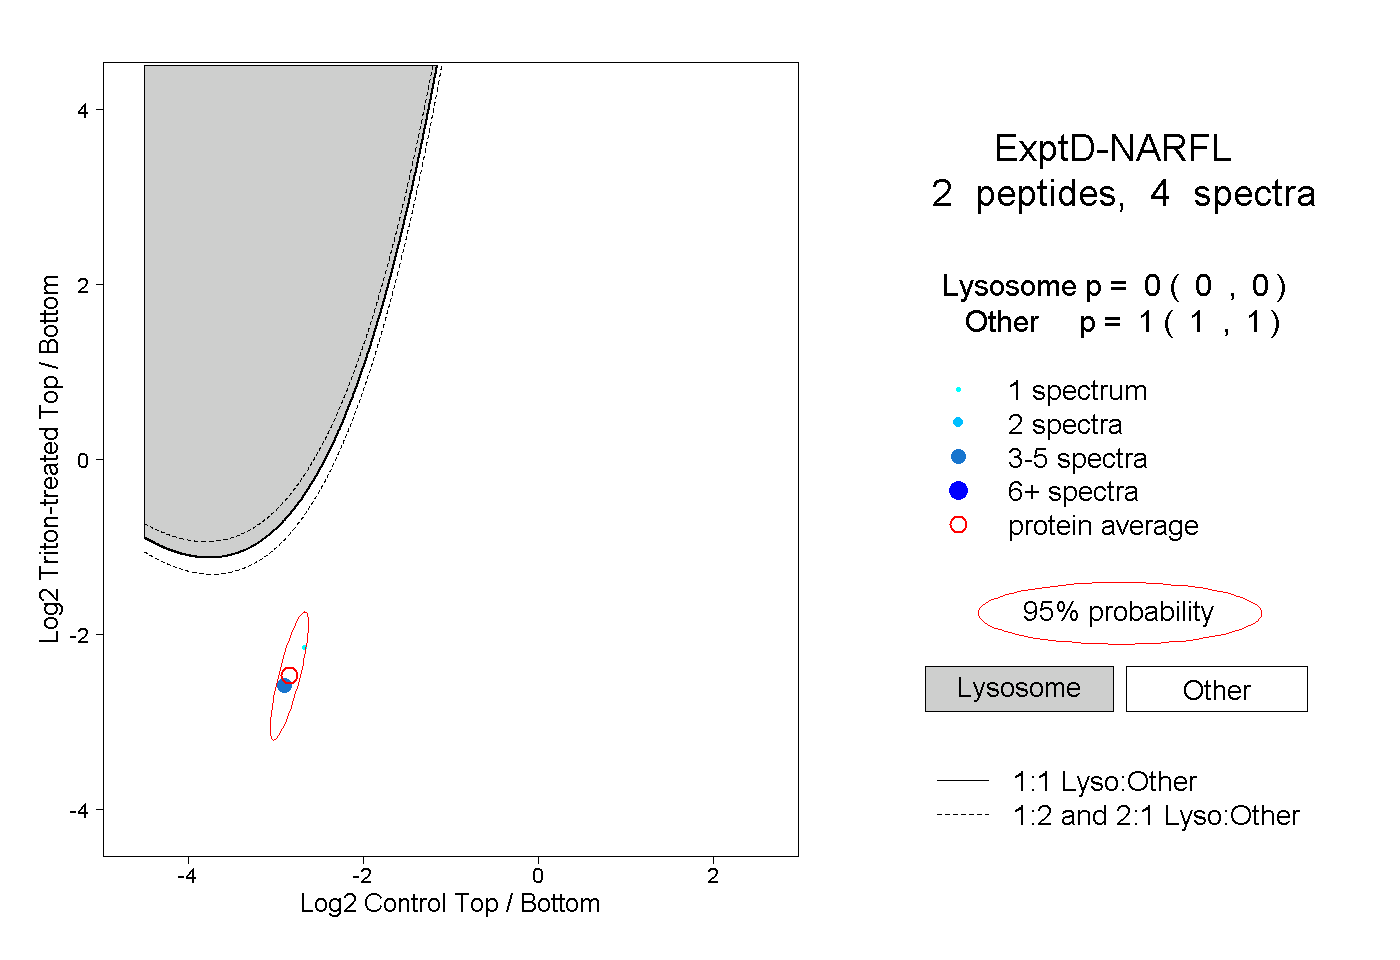 |
0.000 0.000 | 0.000 |
1.000 1.000 | 1.000 |