 5
5peptides
spectra
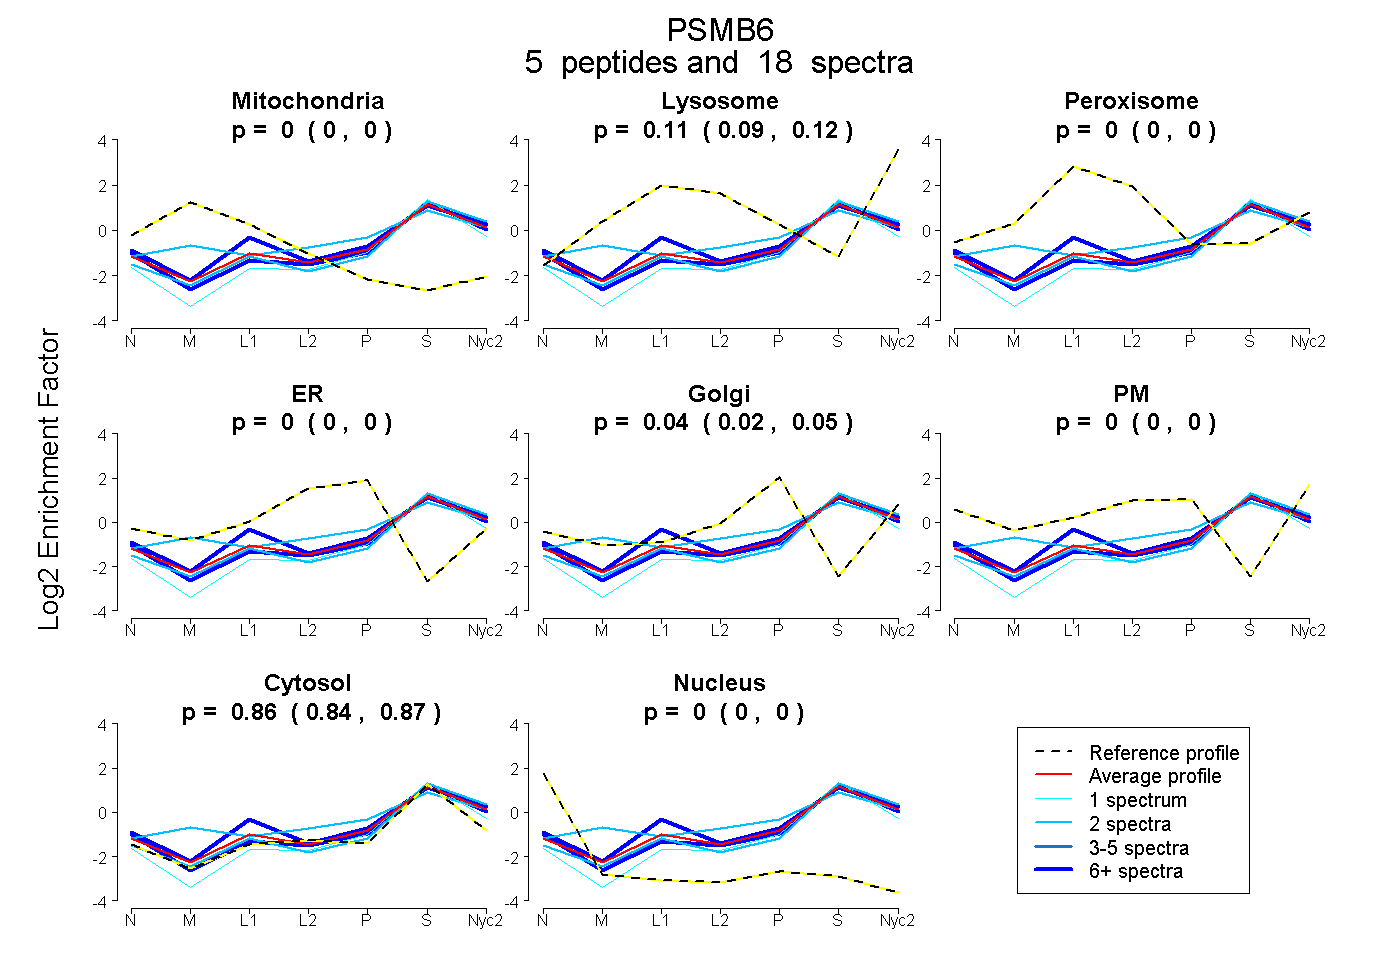
0.000 | 0.000
0.087 | 0.122
0.000 | 0.000
0.000 | 0.000
0.020 | 0.050
0.000 | 0.000
0.843 | 0.867
0.000 | 0.000
4peptides
spectra
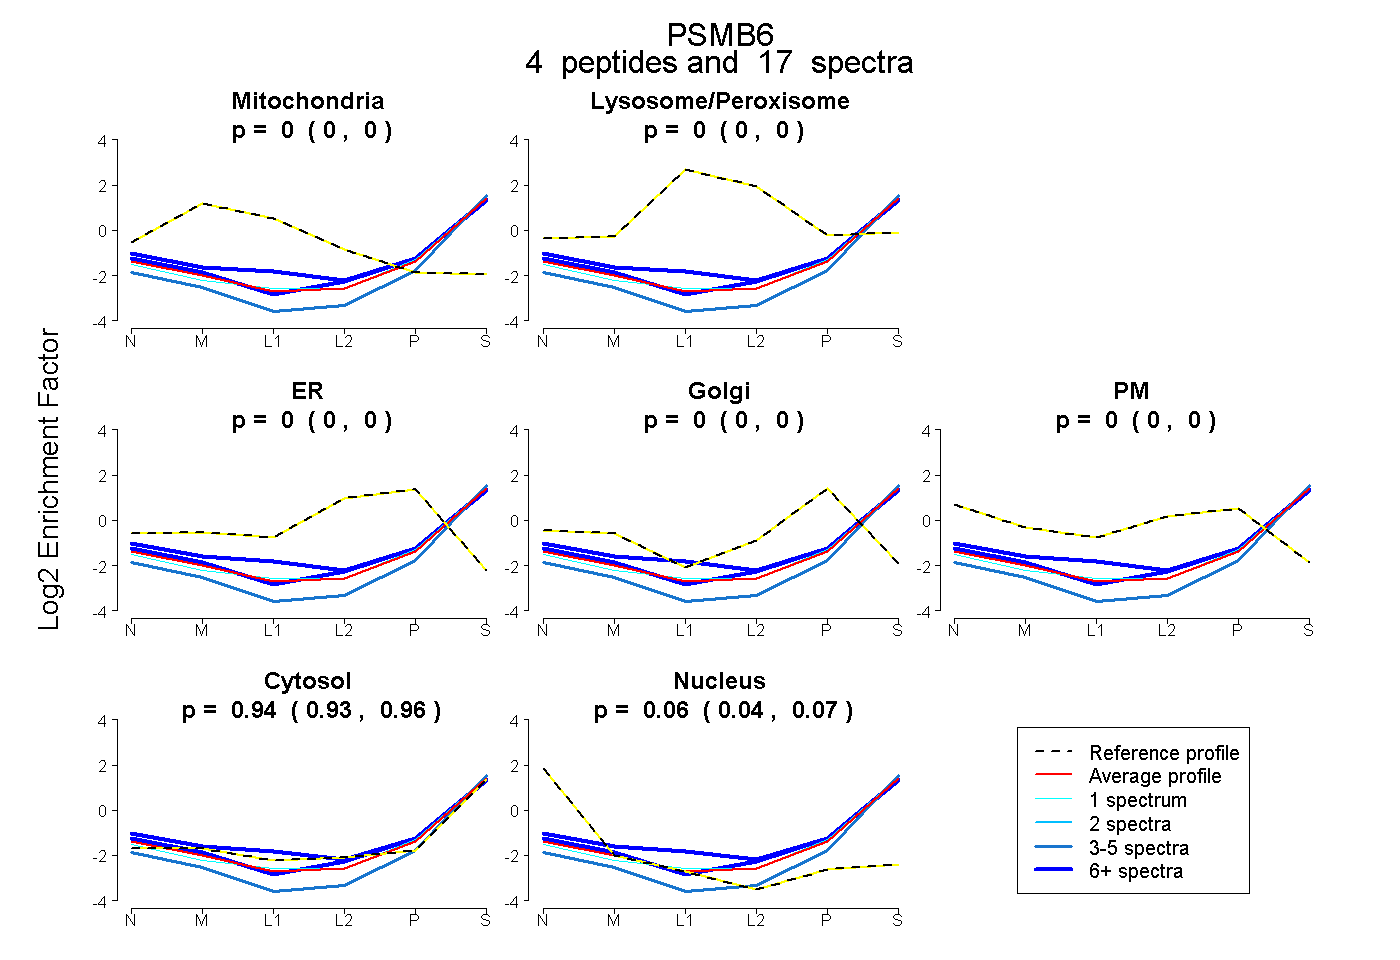
0.000 | 0.000
0.000 | 0.000
0.000 | 0.000
0.000 | 0.002
0.000 | 0.000
0.931 | 0.955
0.040 | 0.068
3peptides
spectra
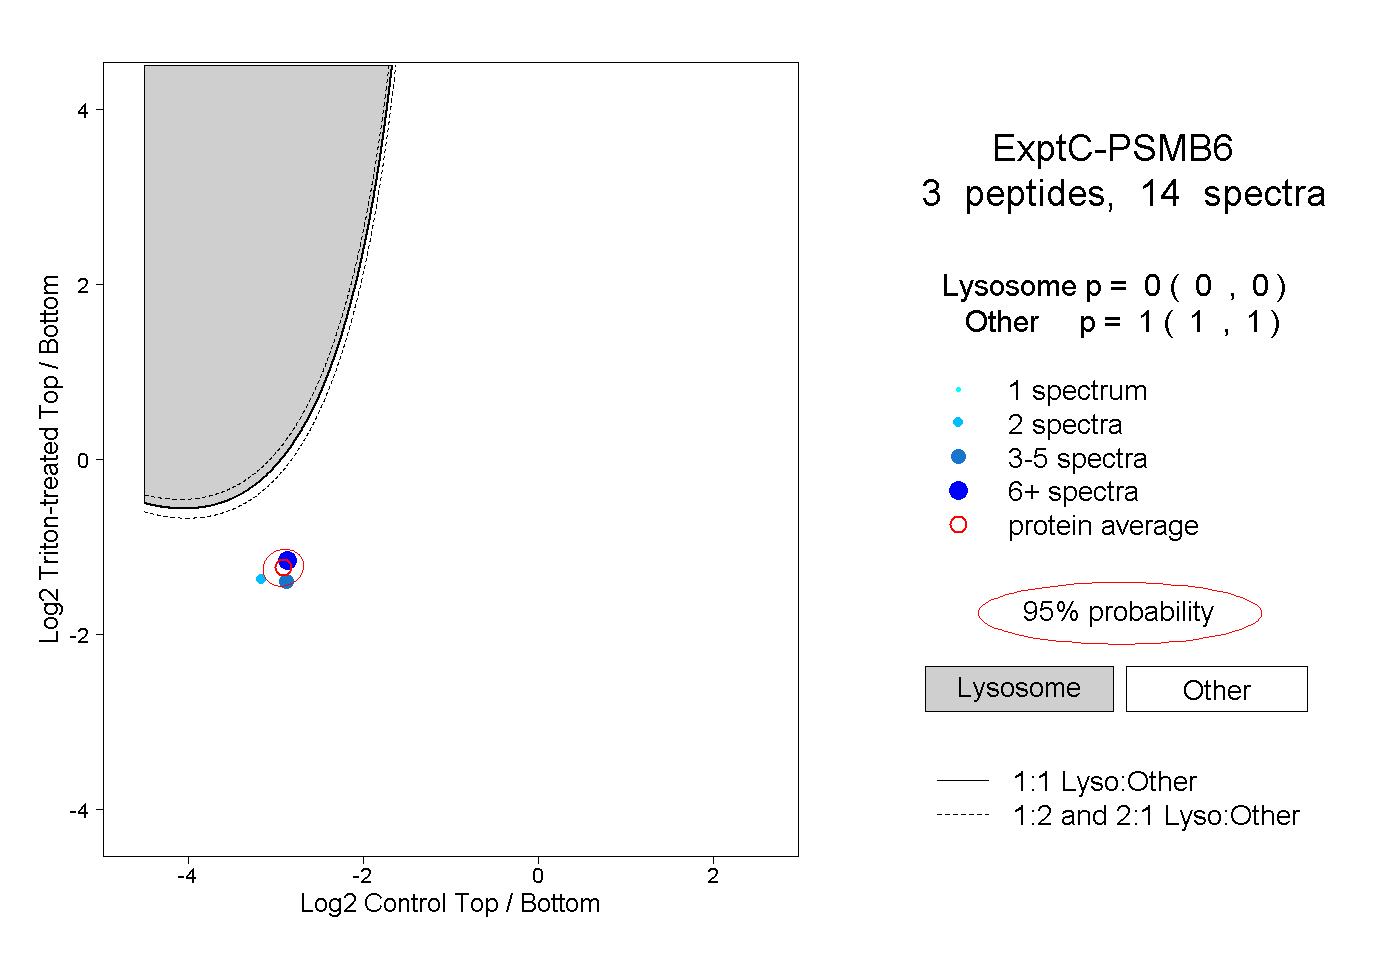
0.000 | 0.000
1.000 | 1.000
1peptide
spectra
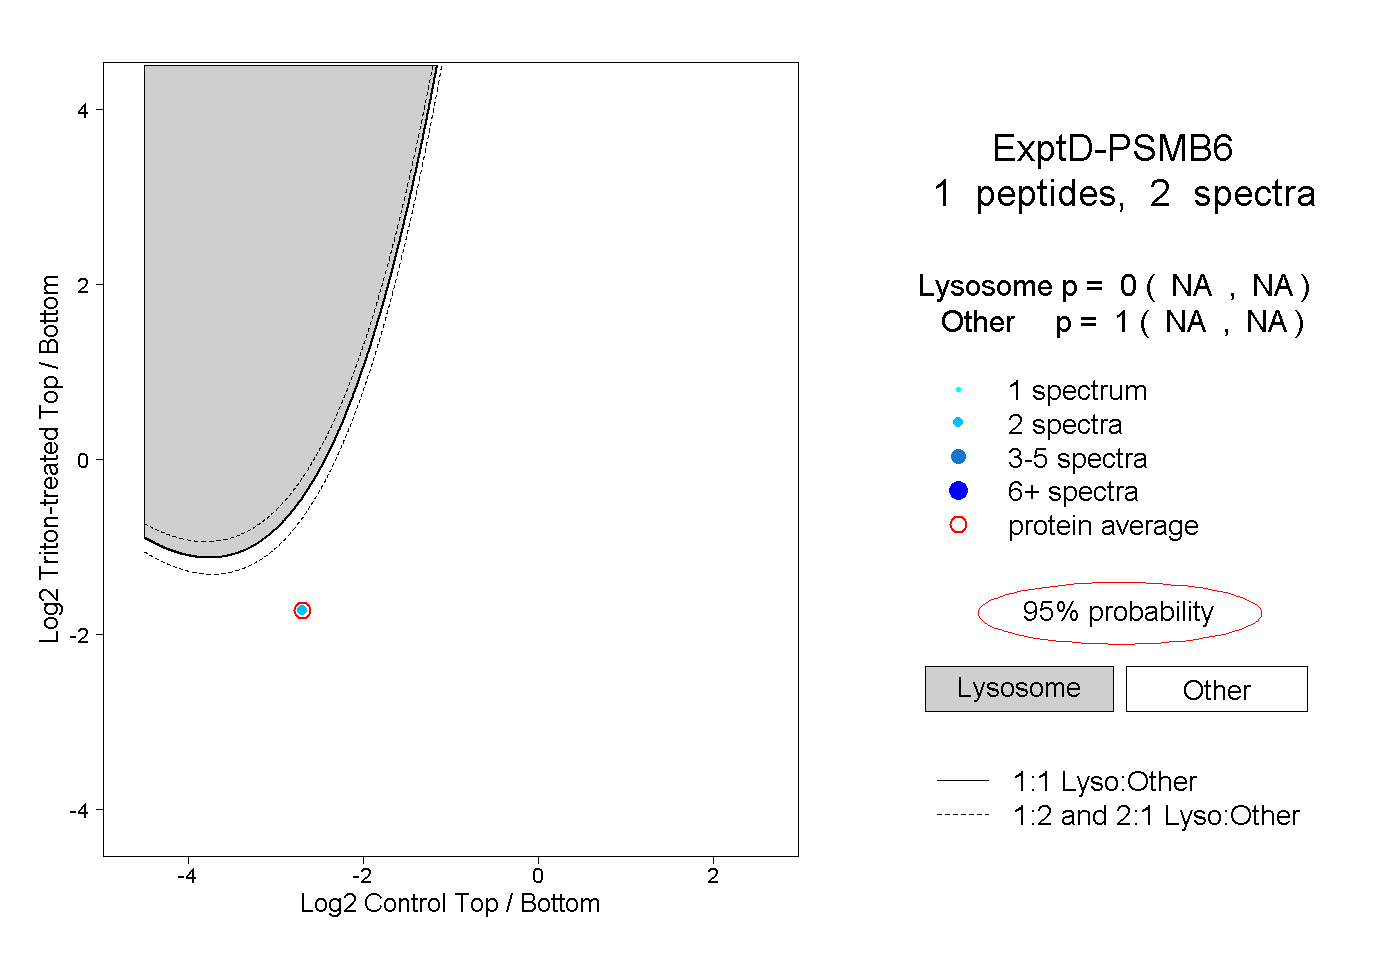
NA | NA
NA | NA