 5
5peptides
spectra
0.000 | 0.000
0.087 | 0.122
0.000 | 0.000
0.000 | 0.000
0.020 | 0.050
0.000 | 0.000
0.843 | 0.867
0.000 | 0.000
| Plot | Mito | Lyso | Perox | ER | Golgi | PM | Cytosol | Nucleus | |||||
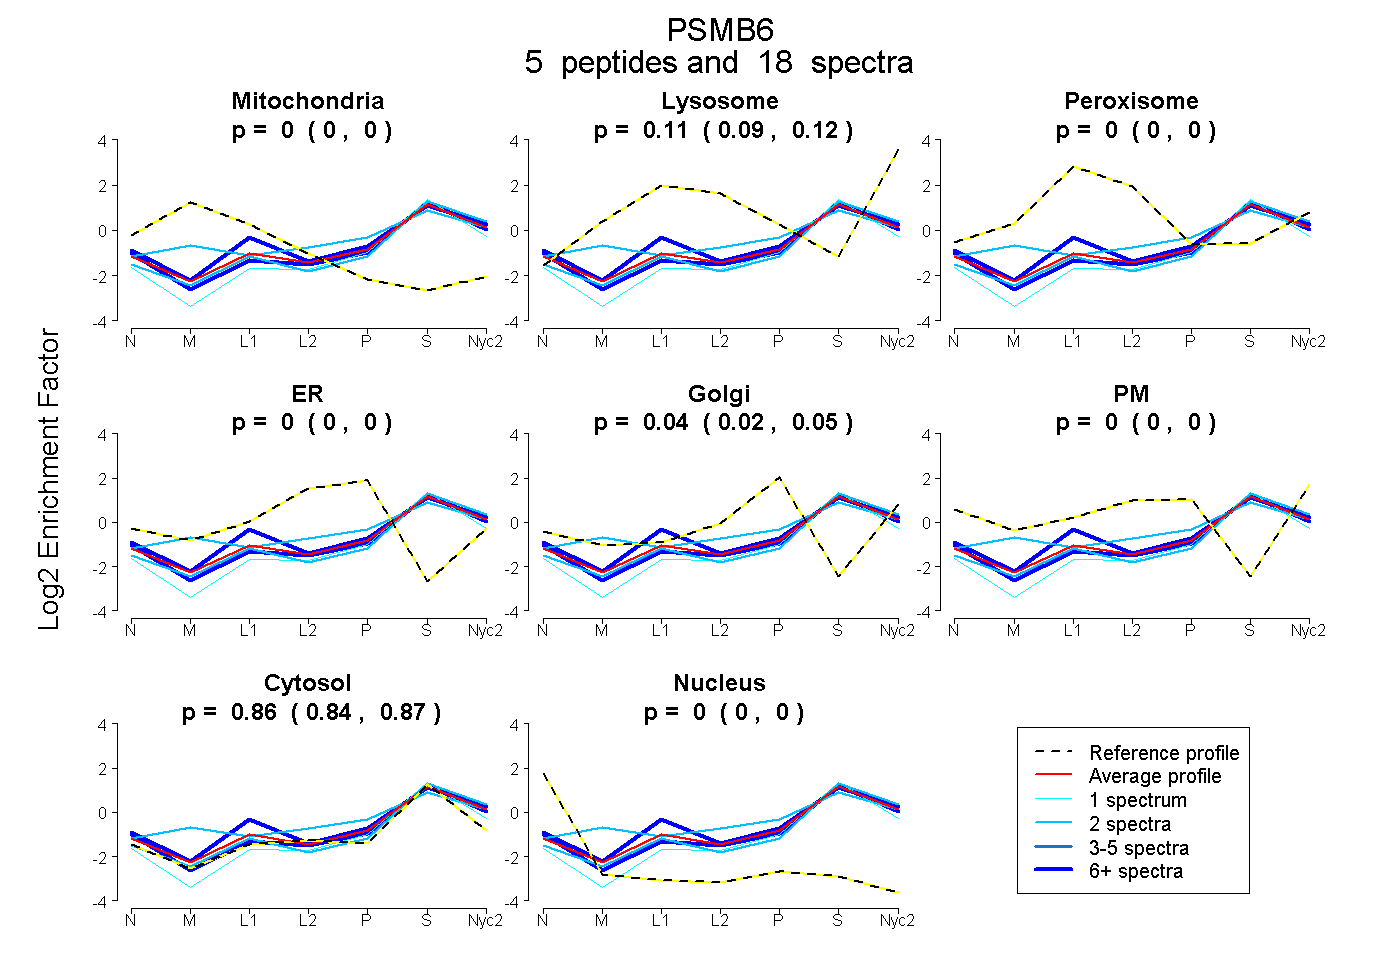
| Expt A |
5 peptides |
18 spectra |
|
0.000 0.000 | 0.000 |
0.107 0.087 | 0.122 |
0.000 0.000 | 0.000 |
0.000 0.000 | 0.000 |
0.037 0.020 | 0.050 |
0.000 0.000 | 0.000 |
0.856 0.843 | 0.867 |
0.000 0.000 | 0.000 |
| 2 spectra, LTPIHDHIFCCR | 0.050 | 0.183 | 0.000 | 0.000 | 0.115 | 0.000 | 0.652 | 0.000 | ||
| 1 spectrum, QVLLGDQIPK | 0.000 | 0.000 | 0.000 | 0.000 | 0.000 | 0.000 | 1.000 | 0.000 | ||
| 7 spectra, LAAIQQSGVER | 0.000 | 0.038 | 0.000 | 0.000 | 0.046 | 0.011 | 0.905 | 0.000 | ||
| 6 spectra, DGSSGGVIR | 0.000 | 0.164 | 0.000 | 0.000 | 0.000 | 0.030 | 0.806 | 0.000 | ||
| 2 spectra, TTTGSYIANR | 0.000 | 0.092 | 0.000 | 0.000 | 0.000 | 0.000 | 0.908 | 0.000 |
| Plot | Mito | Lyso or Perox | ER | Golgi | PM | Cytosol | Nucleus | ||||||
| Expt B |
4 peptides |
17 spectra |
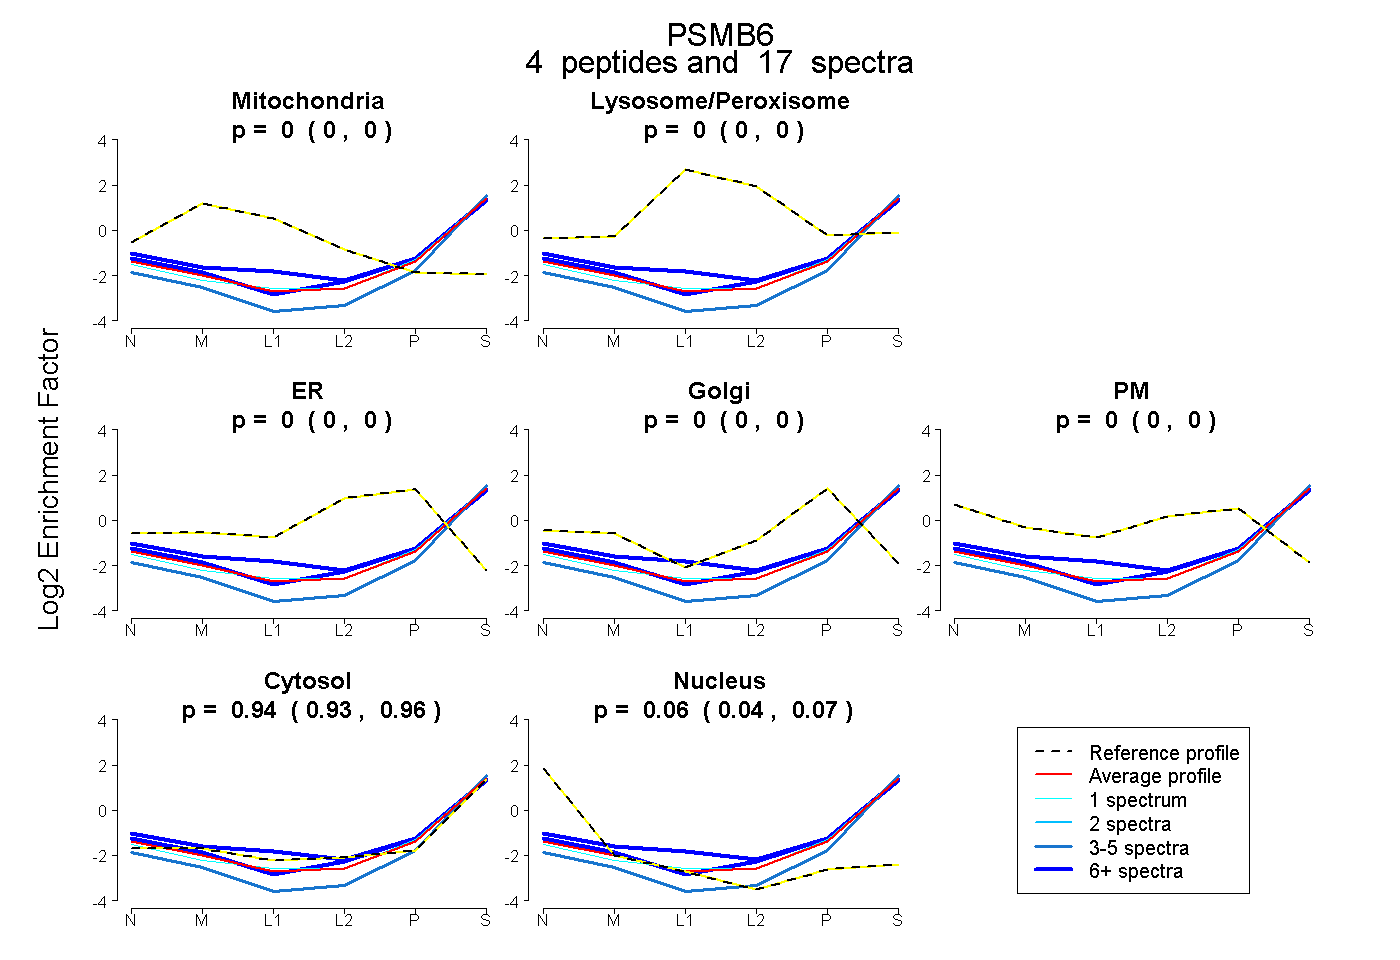 |
0.000 0.000 | 0.000 |
0.000 0.000 | 0.000 |
0.000 0.000 | 0.000 |
0.000 0.000 | 0.002 |
0.000 0.000 | 0.000 |
0.944 0.931 | 0.955 |
0.056 0.040 | 0.068 |
|||
| Plot | Lyso | Other | |||||||||||
| Expt C |
3 peptides |
14 spectra |
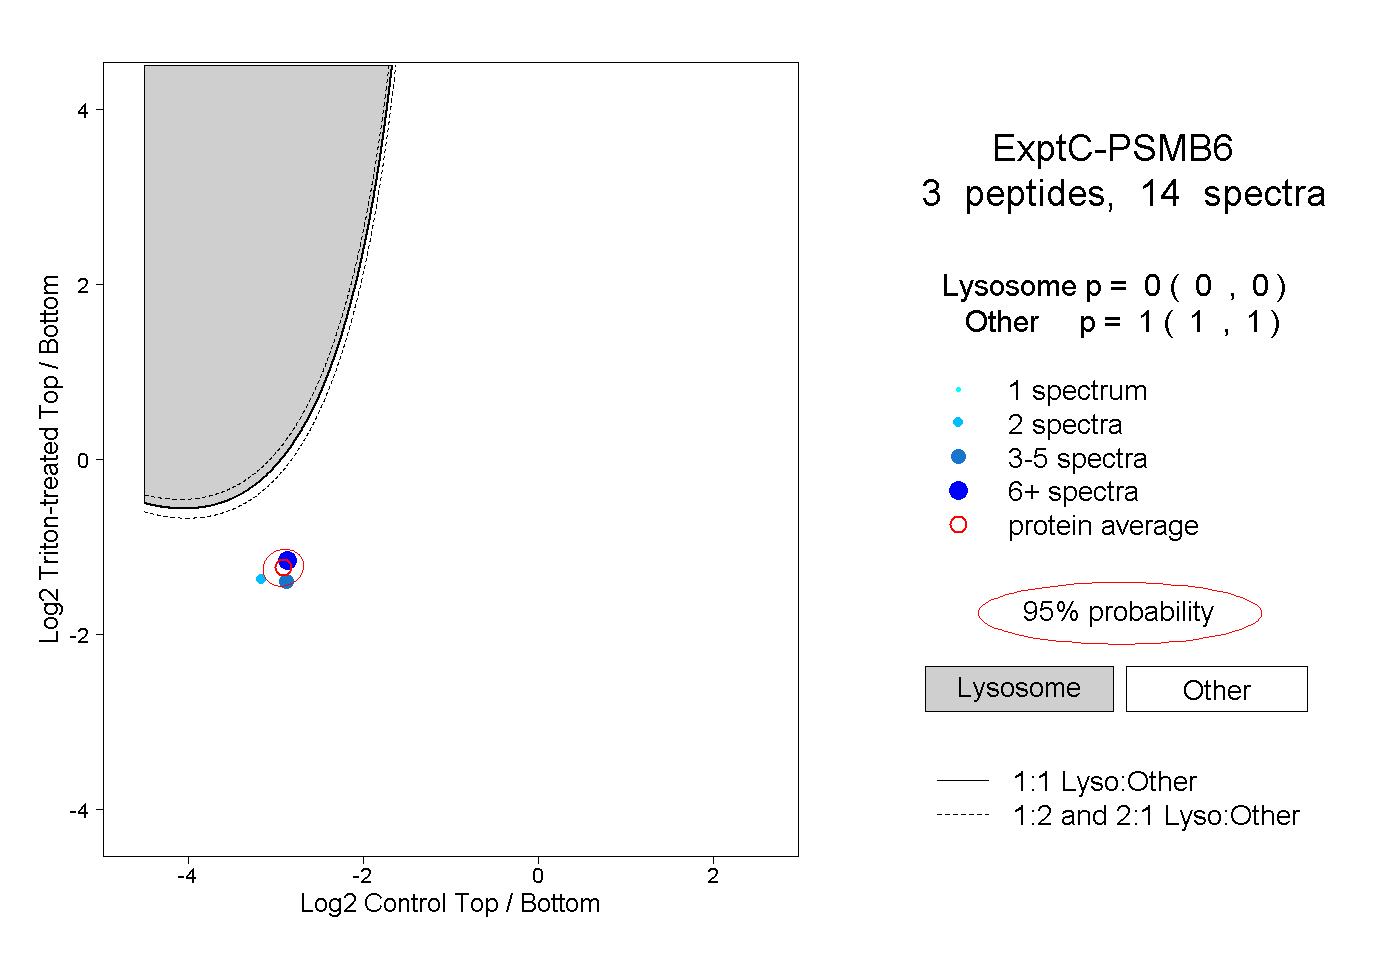 |
0.000 0.000 | 0.000 |
1.000 1.000 | 1.000 |
||||||||
| Plot | Lyso | Other | |||||||||||
| Expt D |
1 peptide |
2 spectra |
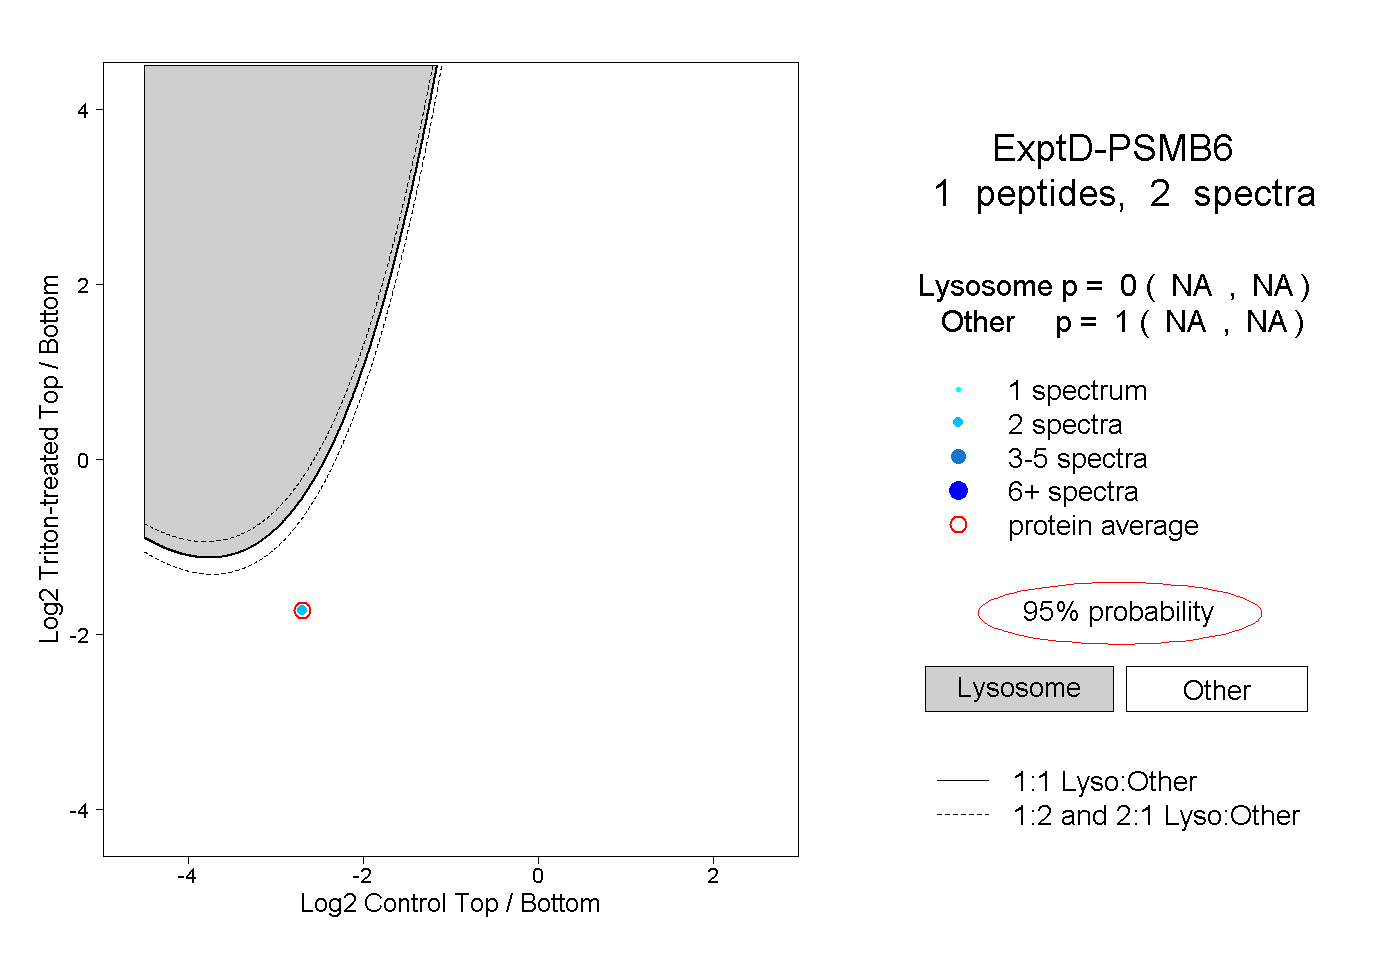 |
0.000 NA | NA |
1.000 NA | NA |