 9
9peptides
spectra
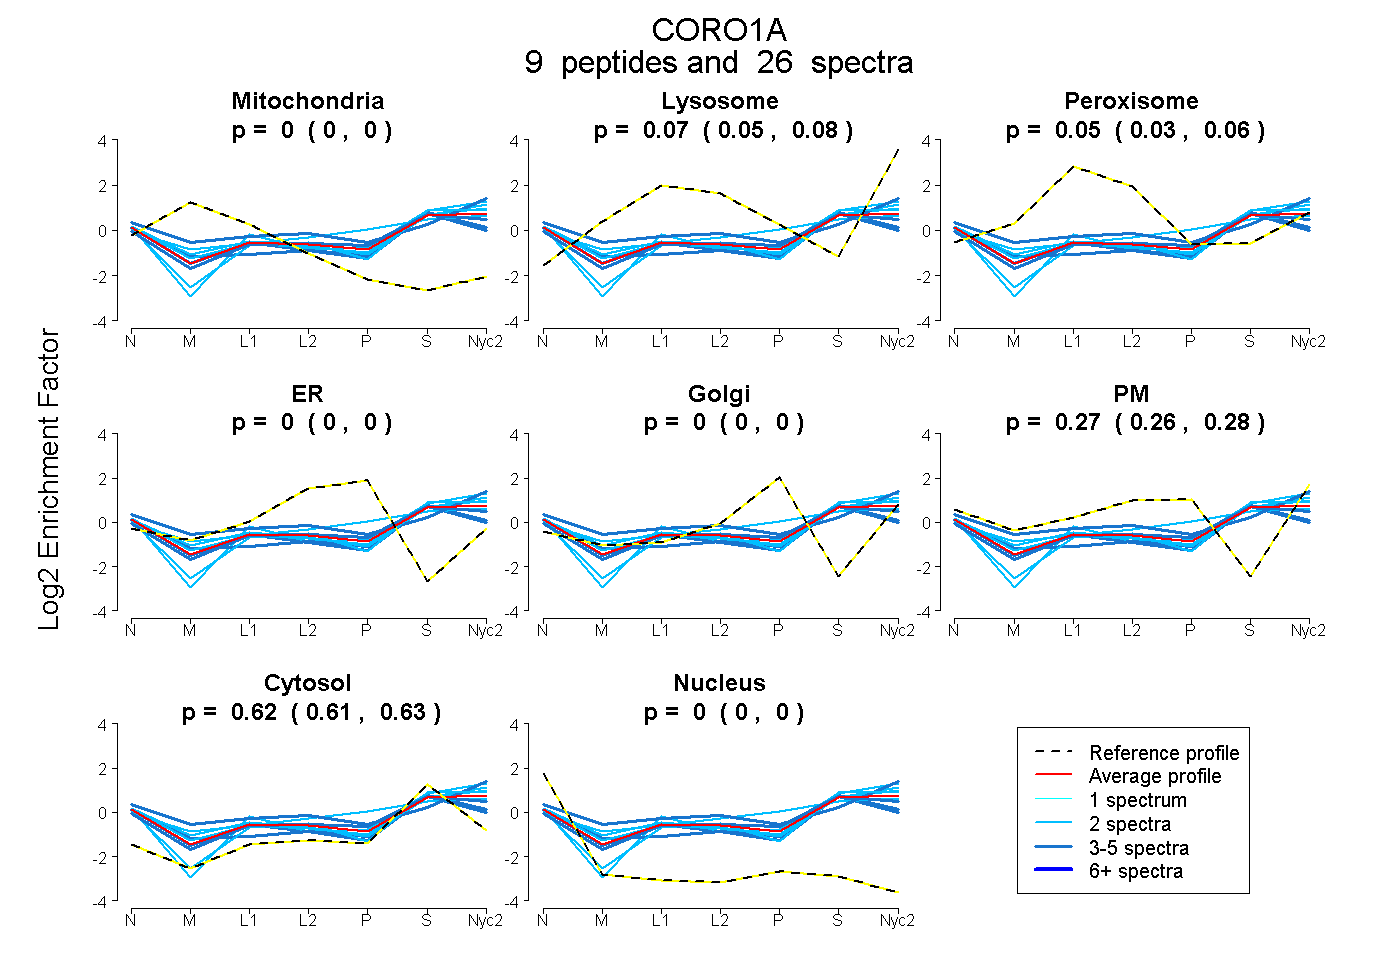
0.000 | 0.000
0.045 | 0.083
0.028 | 0.063
0.000 | 0.000
0.000 | 0.000
0.259 | 0.277
0.611 | 0.625
0.000 | 0.000
3peptides
spectra
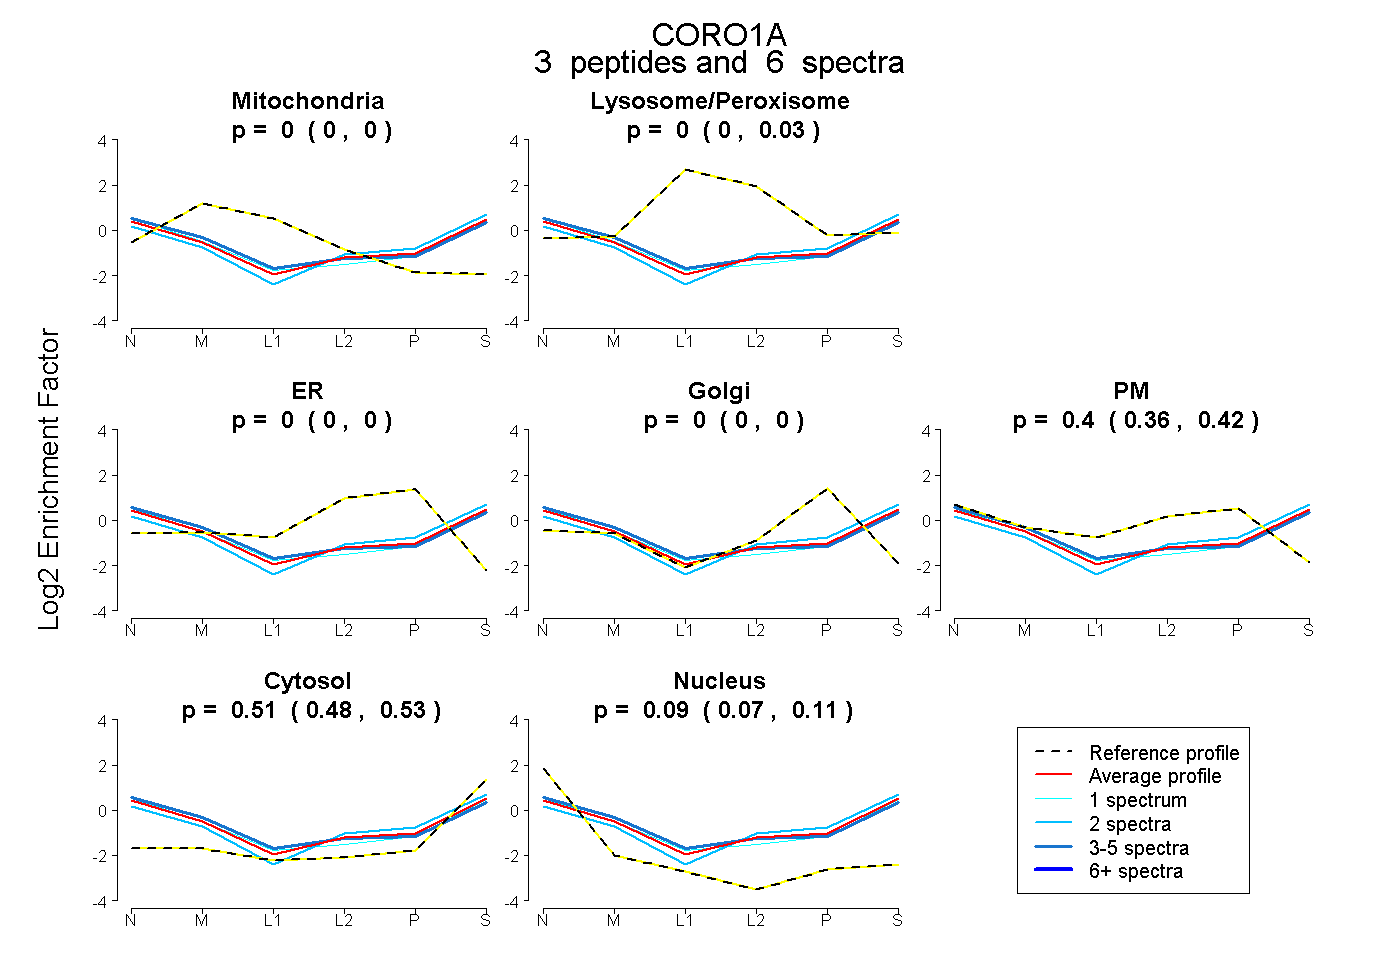
0.000 | 0.000
0.000 | 0.032
0.000 | 0.000
0.000 | 0.000
0.359 | 0.419
0.484 | 0.527
0.066 | 0.110
13peptides
spectra
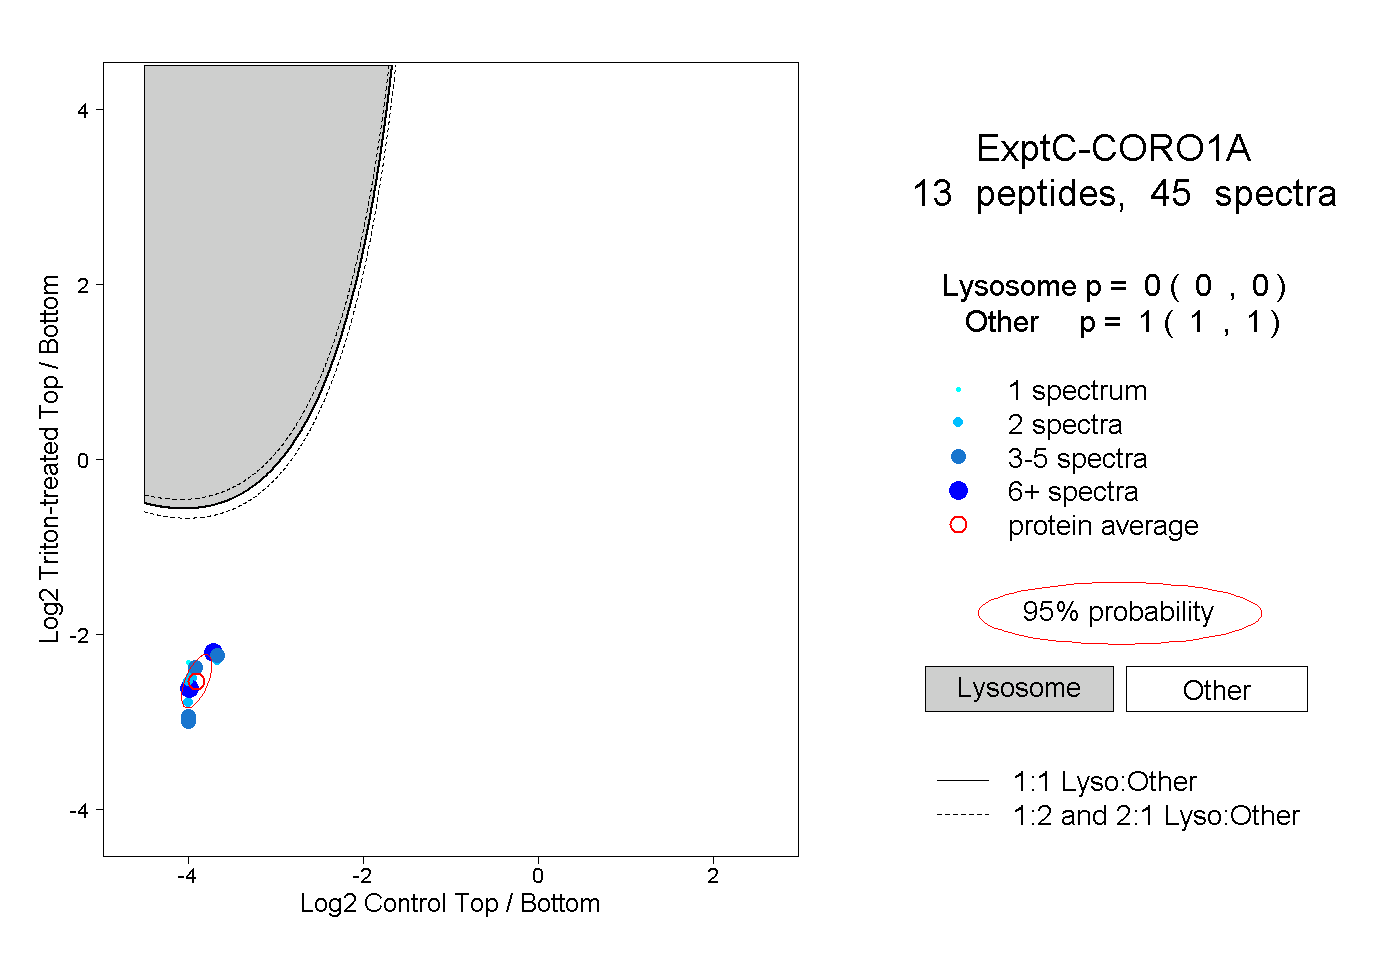
0.000 | 0.000
1.000 | 1.000
3peptides
spectra
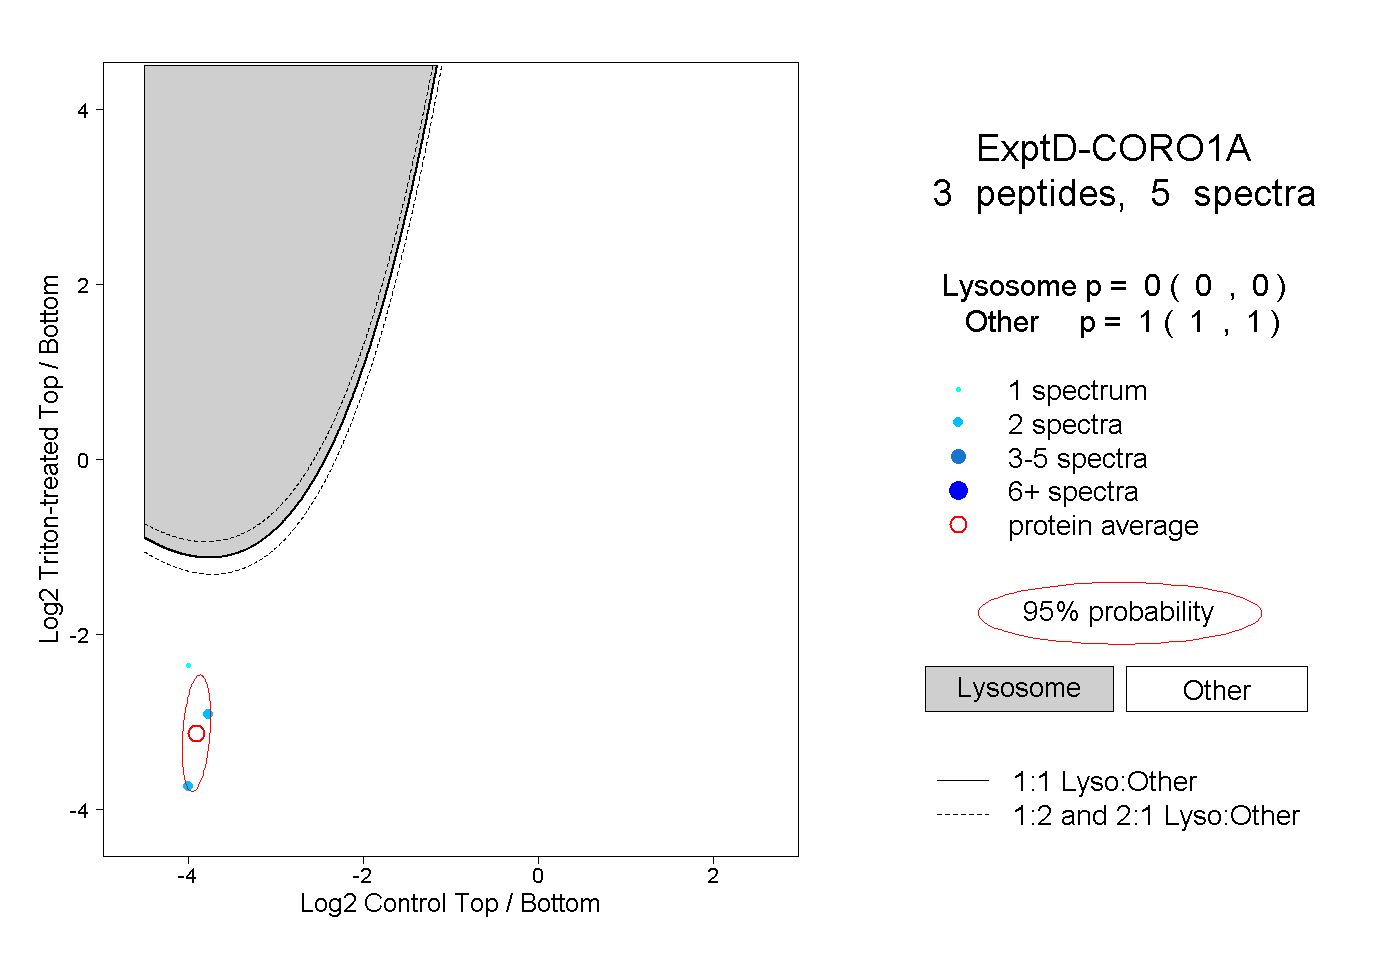
0.000 | 0.000
1.000 | 1.000