 9
9peptides
spectra
0.000 | 0.000
0.045 | 0.083
0.028 | 0.063
0.000 | 0.000
0.000 | 0.000
0.259 | 0.277
0.611 | 0.625
0.000 | 0.000
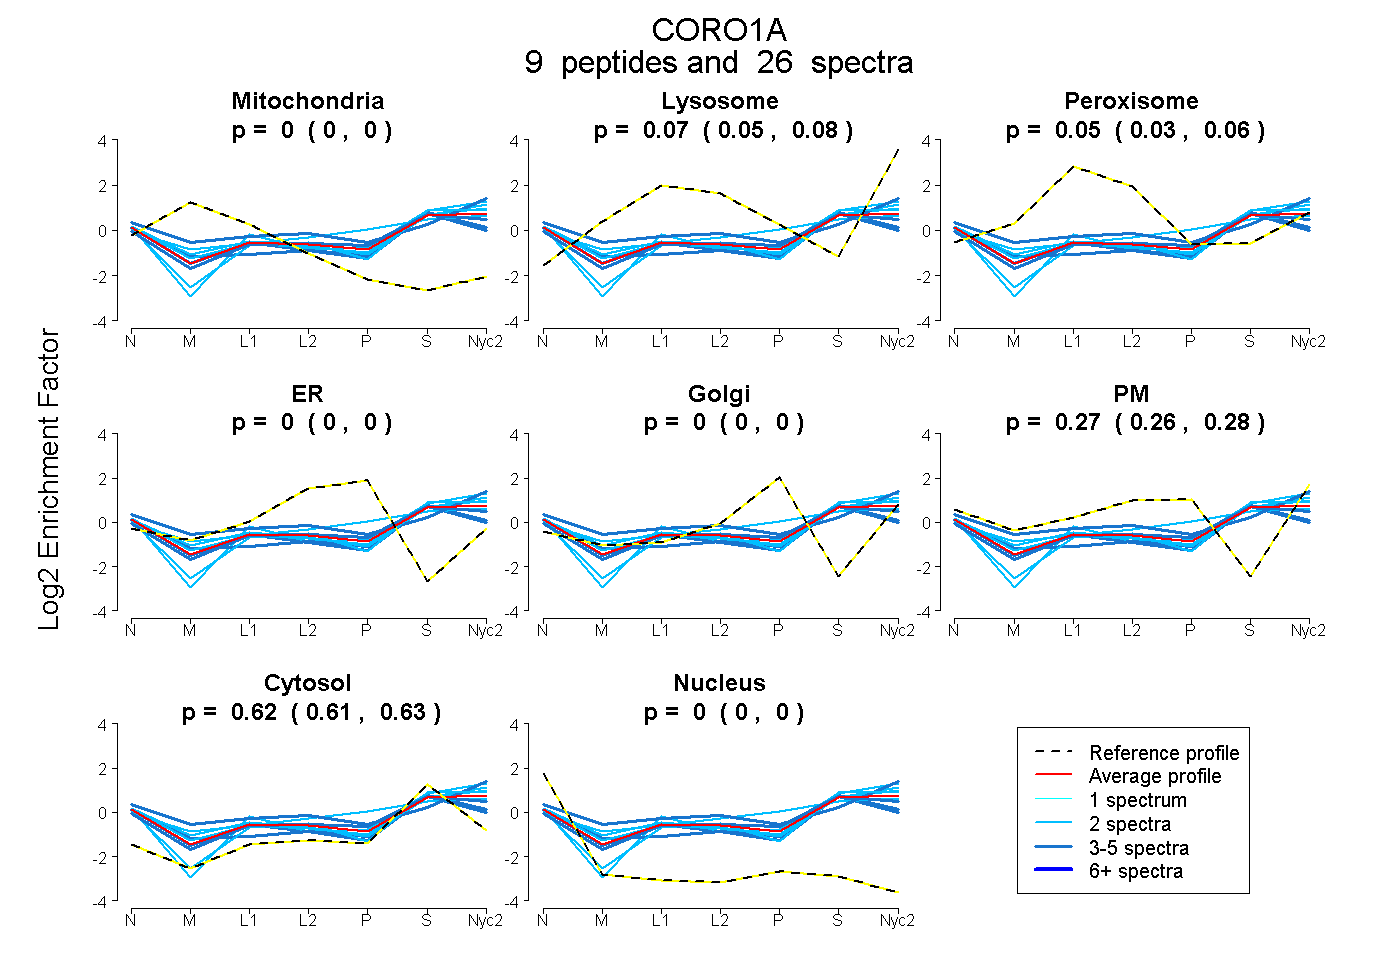
| Plot | Mito | Lyso | Perox | ER | Golgi | PM | Cytosol | Nucleus | |||||
| Expt A |
9 peptides |
26 spectra |
|
0.000 0.000 | 0.000 |
0.066 0.045 | 0.083 |
0.046 0.028 | 0.063 |
0.000 0.000 | 0.000 |
0.000 0.000 | 0.000 |
0.269 0.259 | 0.277 |
0.619 0.611 | 0.625 |
0.000 0.000 | 0.000 |
| 5 spectra, ILTTGFSR | 0.000 | 0.166 | 0.052 | 0.000 | 0.000 | 0.353 | 0.429 | 0.000 | ||
| 2 spectra, ATPEPSSTLSSDTVSR | 0.000 | 0.124 | 0.000 | 0.000 | 0.000 | 0.197 | 0.679 | 0.000 | ||
| 2 spectra, EPVVTLEGHTK | 0.000 | 0.157 | 0.000 | 0.000 | 0.000 | 0.223 | 0.601 | 0.019 | ||
| 4 spectra, QVALWDTK | 0.000 | 0.025 | 0.059 | 0.000 | 0.000 | 0.273 | 0.644 | 0.000 | ||
| 3 spectra, DGALICTSCR | 0.060 | 0.000 | 0.029 | 0.000 | 0.000 | 0.227 | 0.668 | 0.016 | ||
| 2 spectra, NLNAIVQK | 0.000 | 0.097 | 0.000 | 0.000 | 0.000 | 0.185 | 0.719 | 0.000 | ||
| 4 spectra, ADQCYEDVR | 0.000 | 0.000 | 0.179 | 0.000 | 0.000 | 0.136 | 0.622 | 0.063 | ||
| 2 spectra, DGYVPPK | 0.000 | 0.245 | 0.006 | 0.000 | 0.000 | 0.152 | 0.551 | 0.047 | ||
| 2 spectra, HVFGQPAK | 0.000 | 0.064 | 0.040 | 0.000 | 0.000 | 0.375 | 0.521 | 0.000 |
| Plot | Mito | Lyso or Perox | ER | Golgi | PM | Cytosol | Nucleus | ||||||
| Expt B |
3 peptides |
6 spectra |
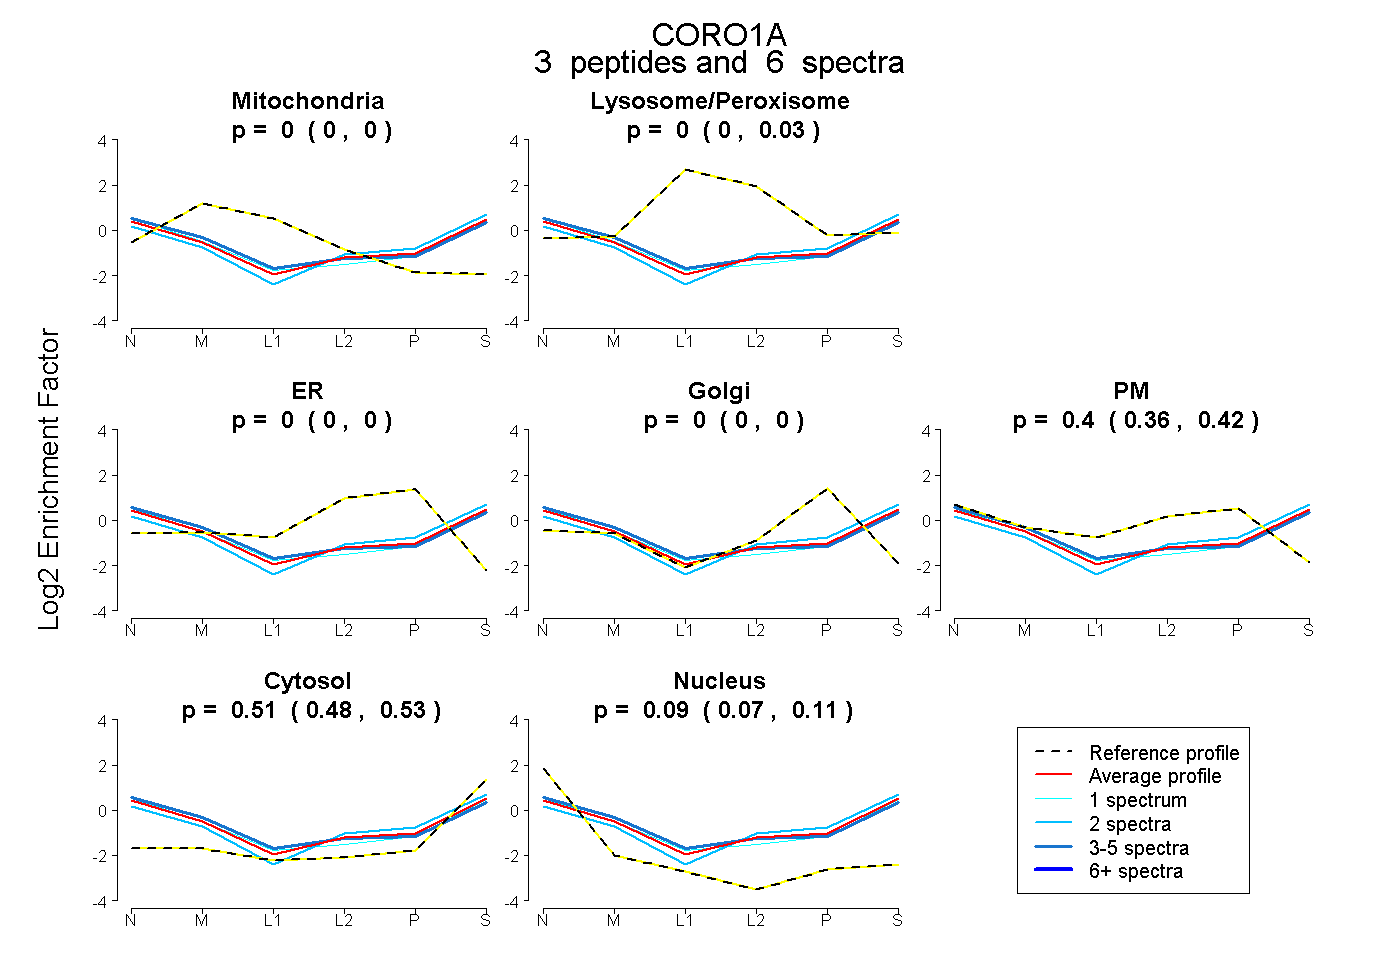 |
0.000 0.000 | 0.000 |
0.000 0.000 | 0.032 |
0.000 0.000 | 0.000 |
0.000 0.000 | 0.000 |
0.403 0.359 | 0.419 |
0.510 0.484 | 0.527 |
0.087 0.066 | 0.110 |
|||
| Plot | Lyso | Other | |||||||||||
| Expt C |
13 peptides |
45 spectra |
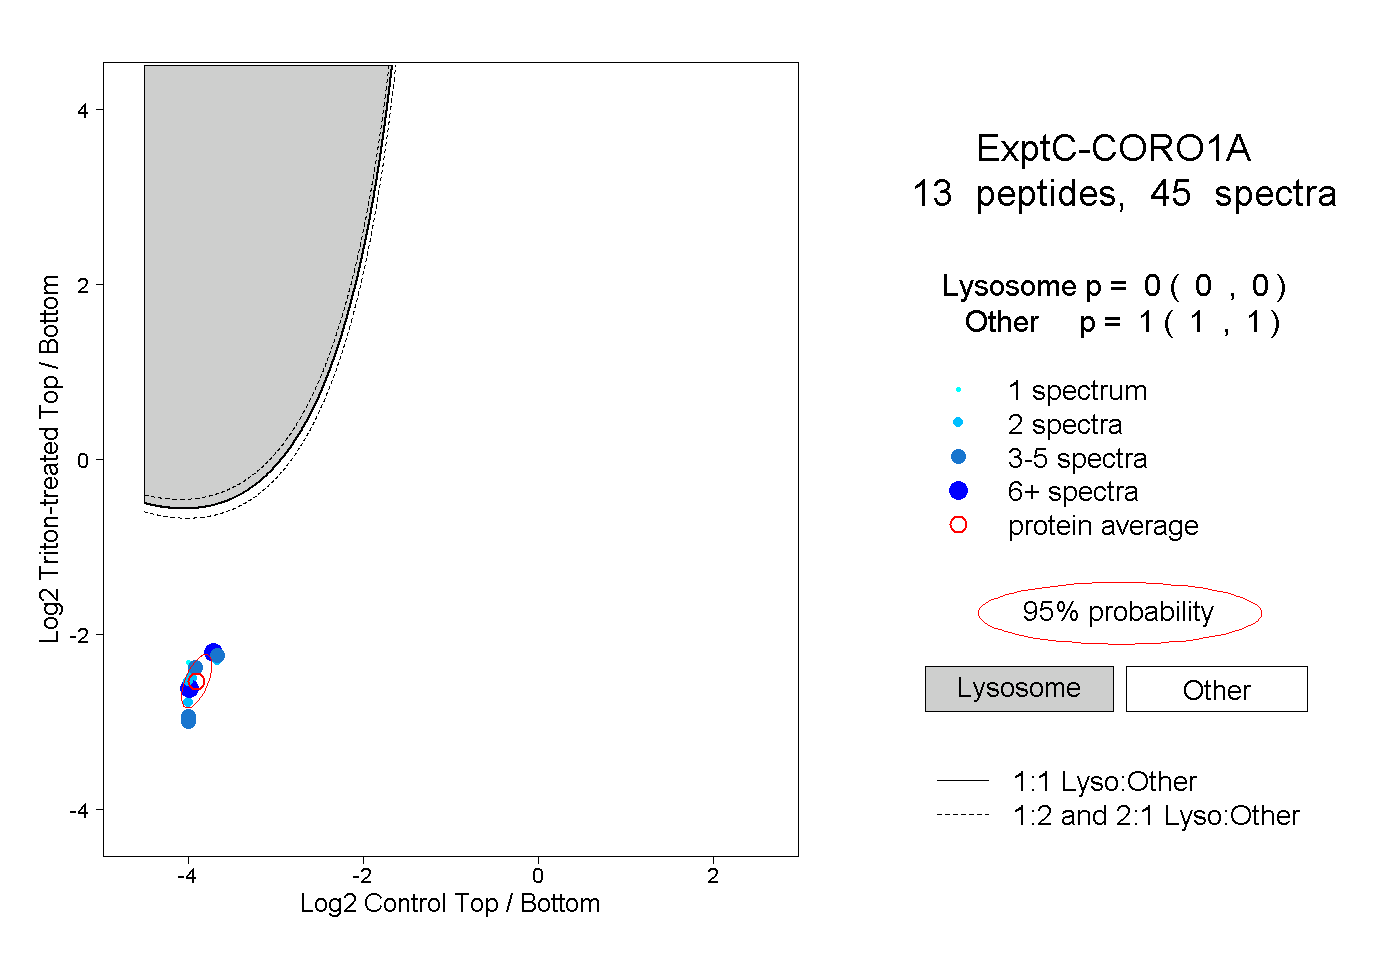 |
0.000 0.000 | 0.000 |
1.000 1.000 | 1.000 |
||||||||
| Plot | Lyso | Other | |||||||||||
| Expt D |
3 peptides |
5 spectra |
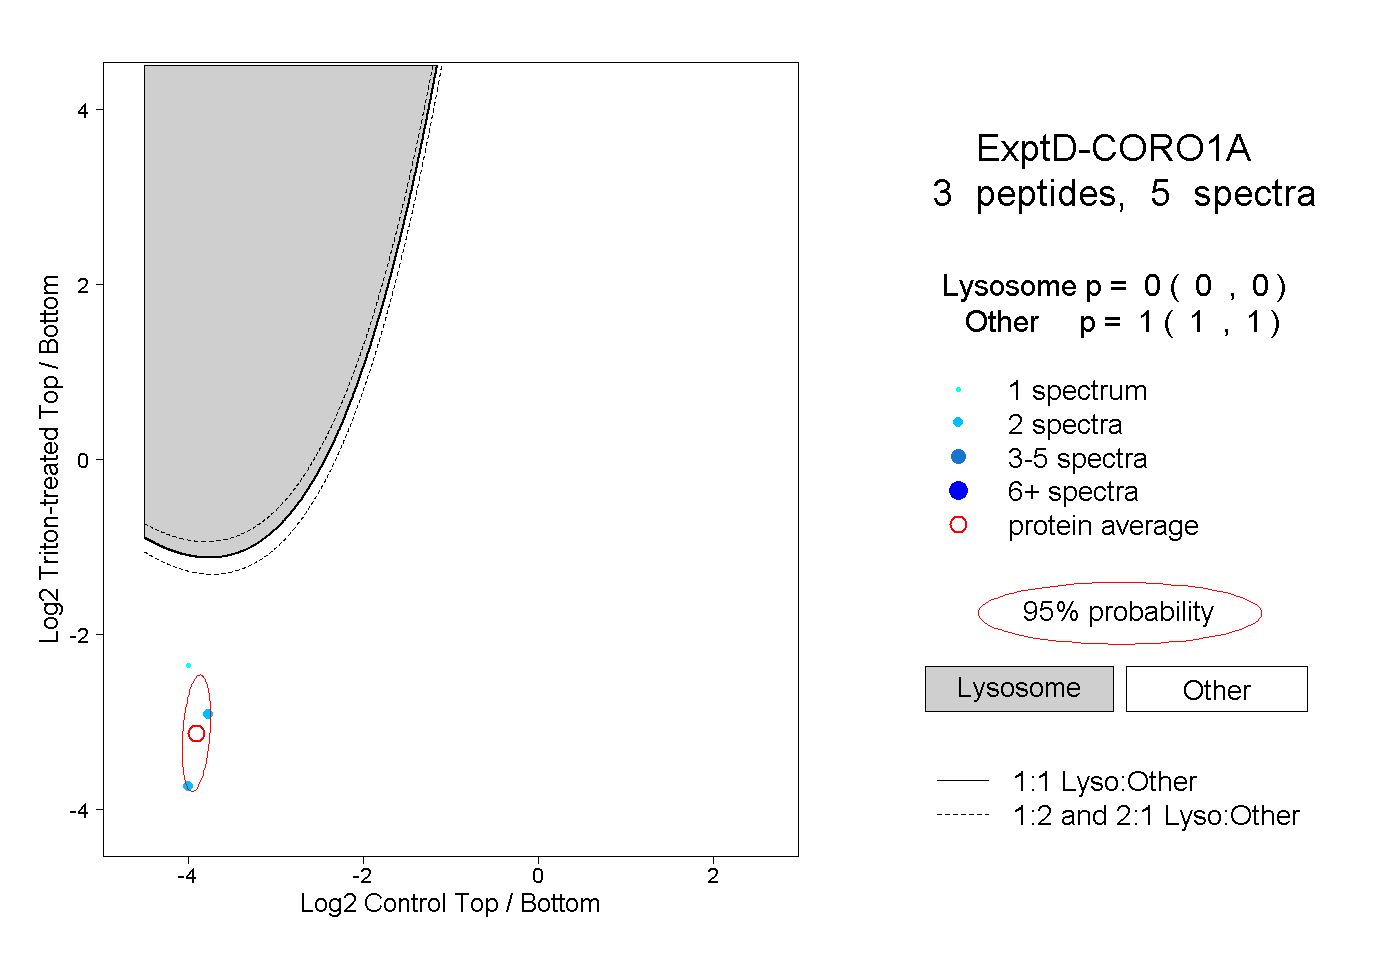 |
0.000 0.000 | 0.000 |
1.000 1.000 | 1.000 |