 5
5peptides
spectra
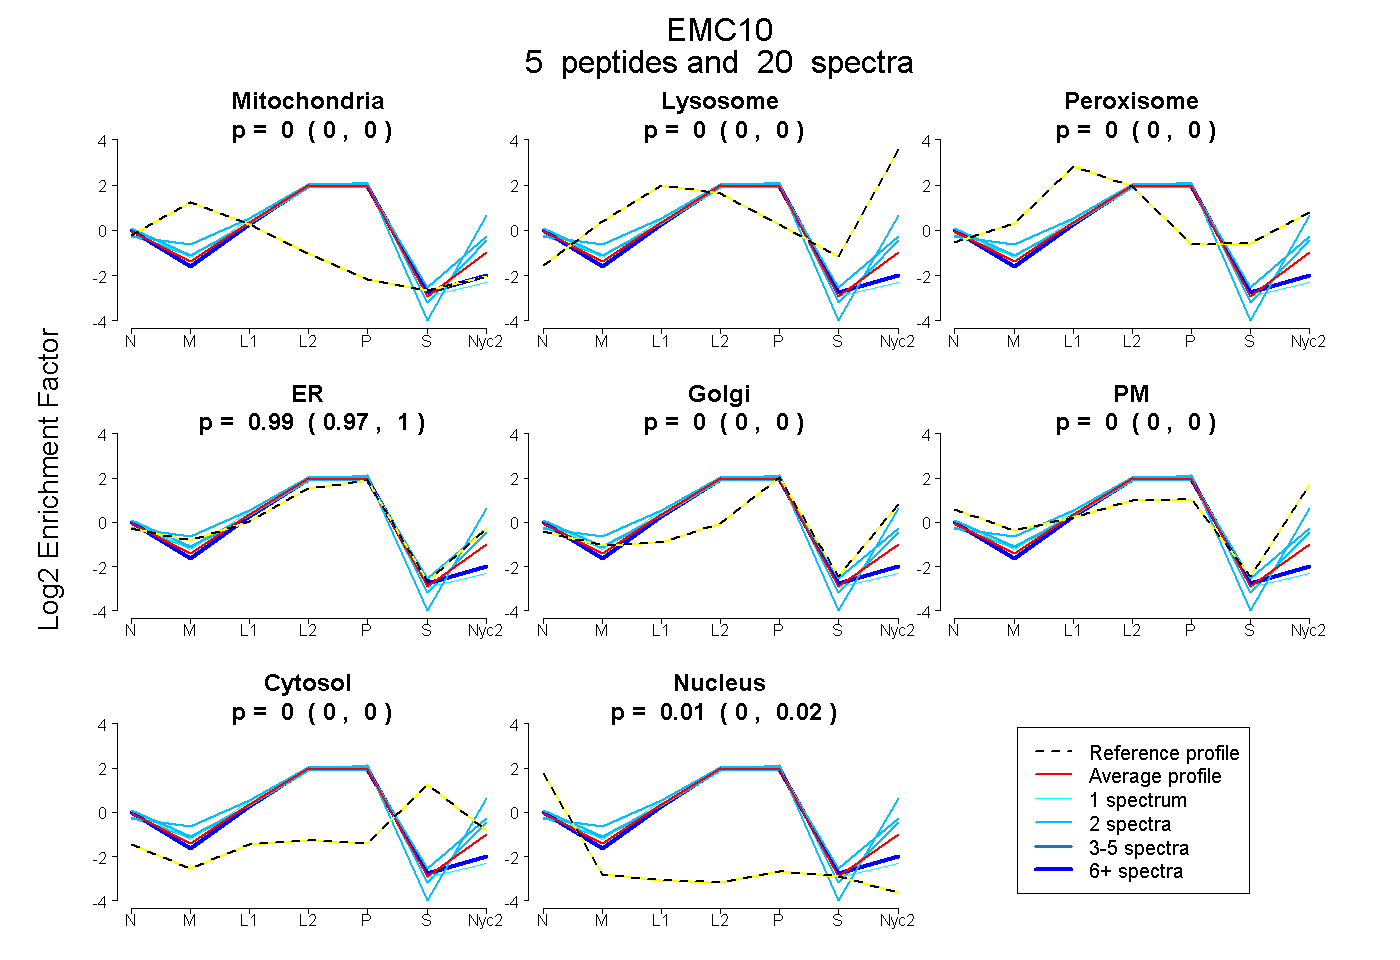
0.000 | 0.000
0.000 | 0.000
0.000 | 0.000
0.975 | 0.997
0.000 | 0.000
0.000 | 0.000
0.000 | 0.000
0.001 | 0.024
2peptides
spectra
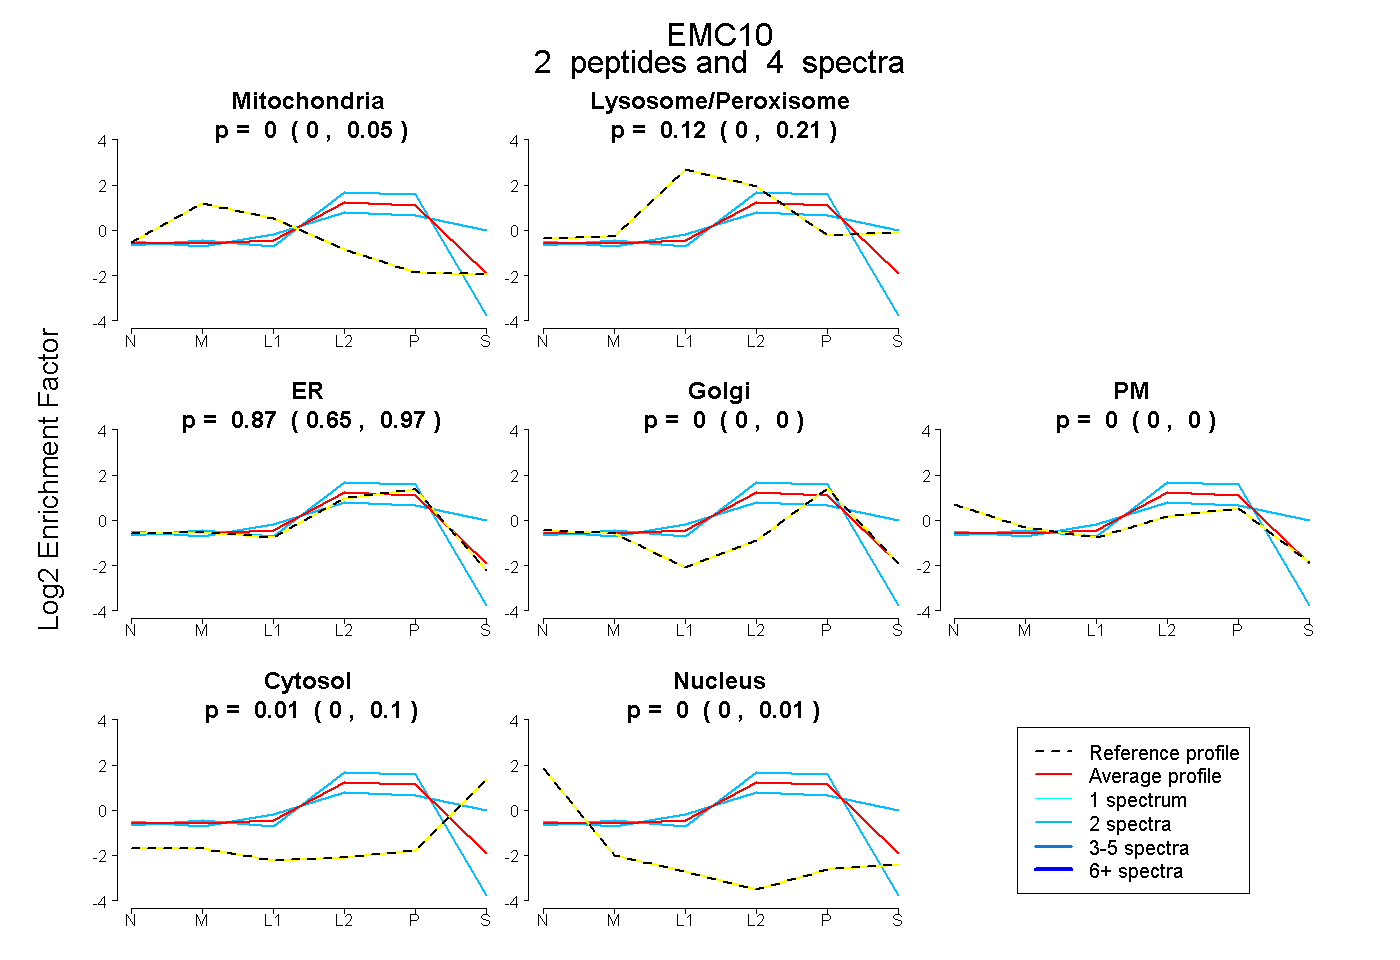
0.000 | 0.047
0.000 | 0.212
0.645 | 0.970
0.000 | 0.000
0.000 | 0.000
0.000 | 0.097
0.000 | 0.008
3peptides
spectra
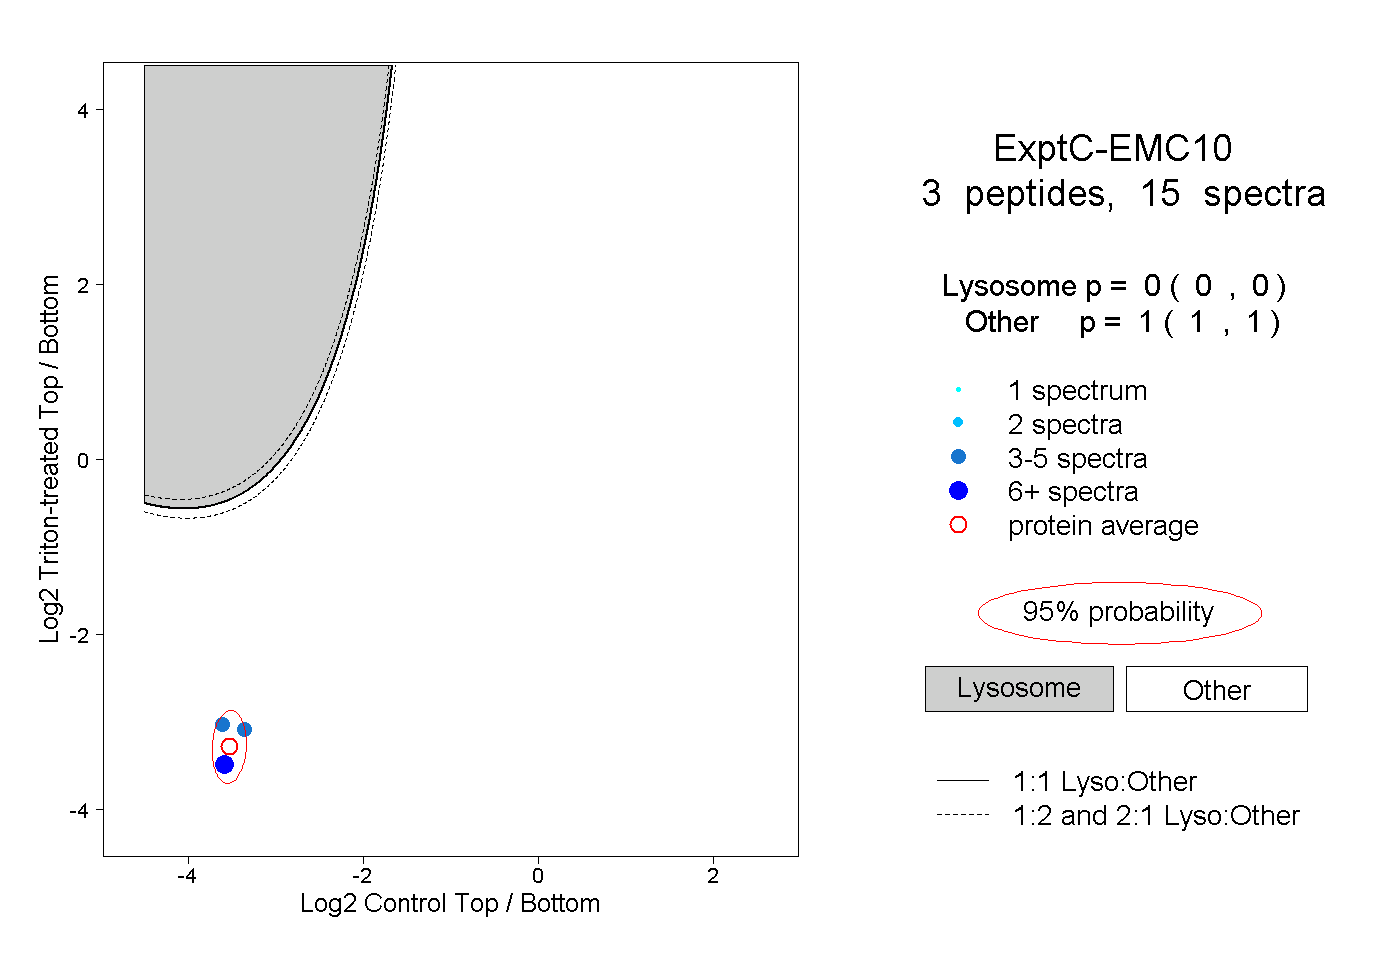
0.000 | 0.000
1.000 | 1.000
1peptide
spectrum
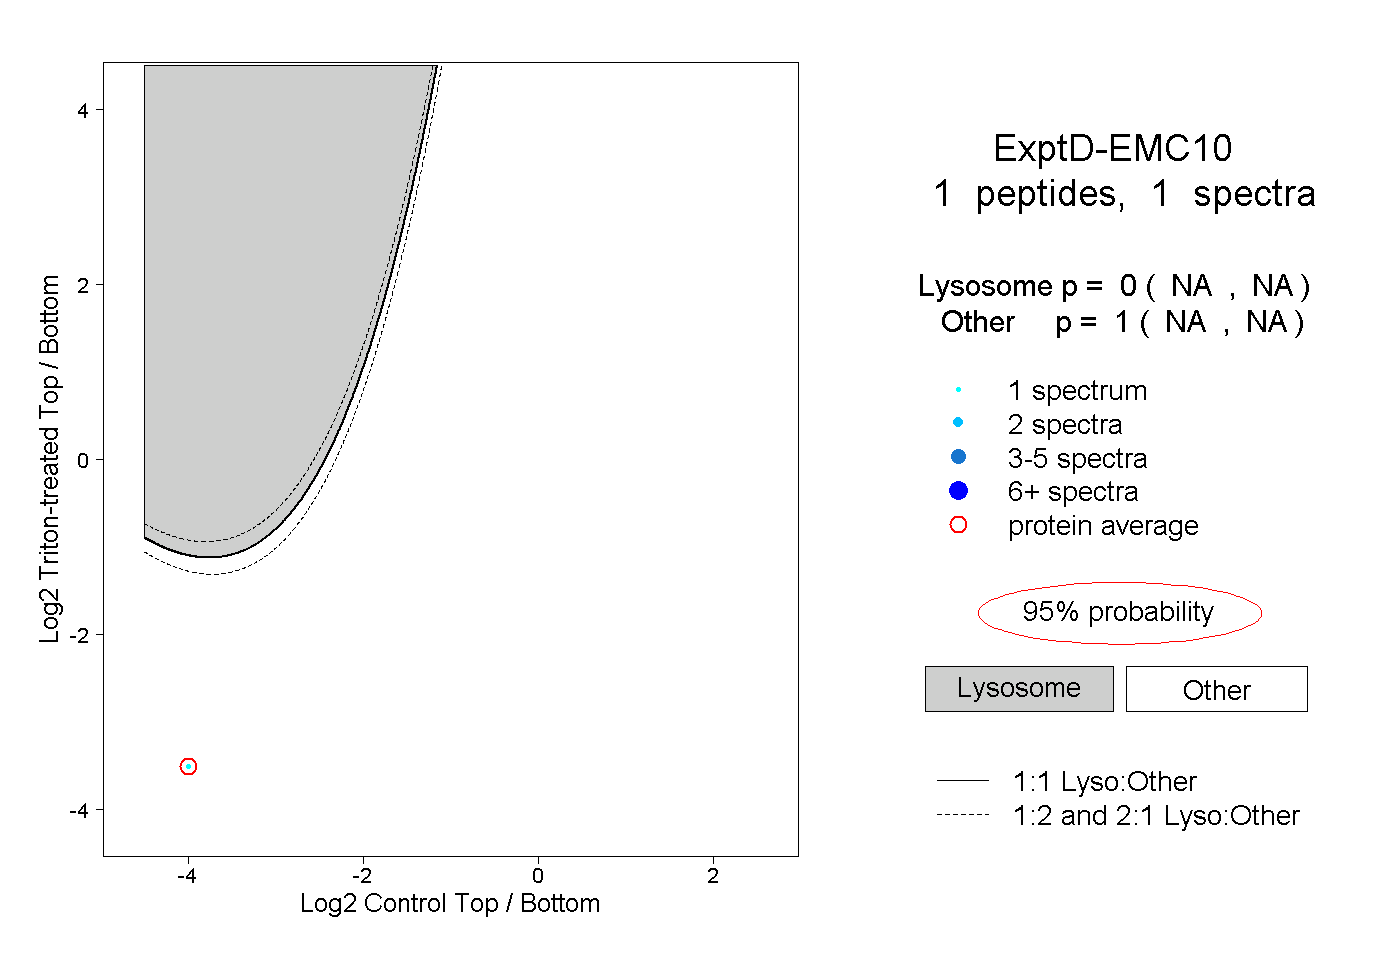
NA | NA
NA | NA