 5
5peptides
spectra
0.000 | 0.000
0.000 | 0.000
0.000 | 0.000
0.975 | 0.997
0.000 | 0.000
0.000 | 0.000
0.000 | 0.000
0.001 | 0.024
| Plot | Mito | Lyso | Perox | ER | Golgi | PM | Cytosol | Nucleus | |||||
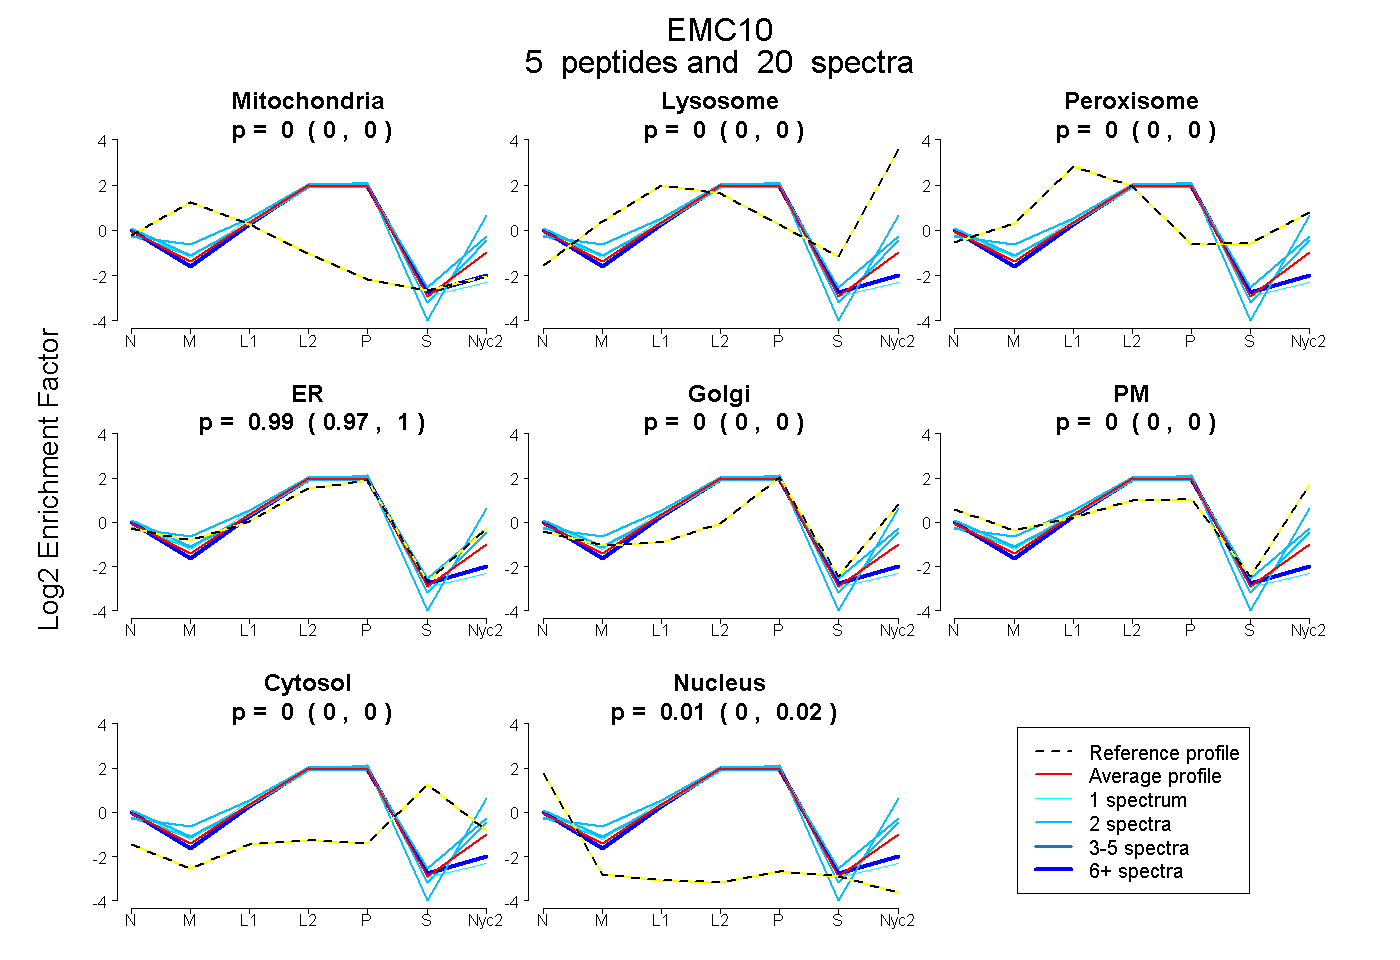
| Expt A |
5 peptides |
20 spectra |
|
0.000 0.000 | 0.000 |
0.000 0.000 | 0.000 |
0.000 0.000 | 0.000 |
0.986 0.975 | 0.997 |
0.000 0.000 | 0.000 |
0.000 0.000 | 0.000 |
0.000 0.000 | 0.000 |
0.014 0.001 | 0.024 |
| 2 spectra, DVAAVNGLYR | 0.000 | 0.000 | 0.000 | 1.000 | 0.000 | 0.000 | 0.000 | 0.000 | ||
| 2 spectra, VGAAAR | 0.000 | 0.034 | 0.000 | 0.798 | 0.000 | 0.169 | 0.000 | 0.000 | ||
| 1 spectrum, GSLLWNQQDGTLSATQR | 0.000 | 0.000 | 0.000 | 0.936 | 0.000 | 0.000 | 0.000 | 0.064 | ||
| 2 spectra, QLSEEER | 0.000 | 0.000 | 0.030 | 0.970 | 0.000 | 0.000 | 0.000 | 0.000 | ||
| 13 spectra, LEMEQAQK | 0.000 | 0.000 | 0.000 | 0.927 | 0.000 | 0.000 | 0.000 | 0.073 |
| Plot | Mito | Lyso or Perox | ER | Golgi | PM | Cytosol | Nucleus | ||||||
| Expt B |
2 peptides |
4 spectra |
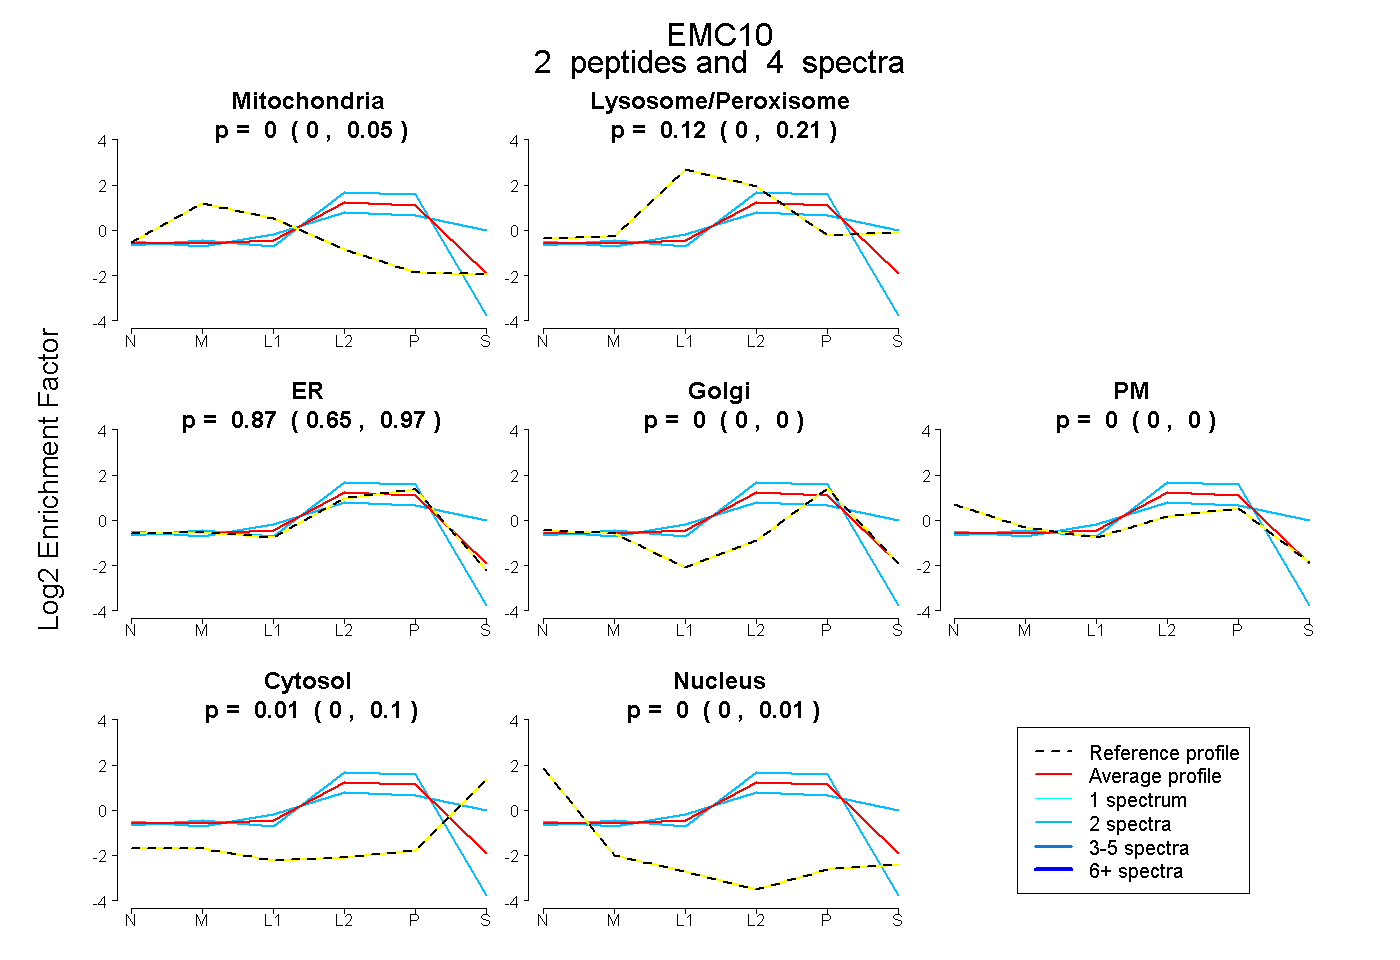 |
0.000 0.000 | 0.047 |
0.118 0.000 | 0.212 |
0.875 0.645 | 0.970 |
0.000 0.000 | 0.000 |
0.000 0.000 | 0.000 |
0.008 0.000 | 0.097 |
0.000 0.000 | 0.008 |
|||
| Plot | Lyso | Other | |||||||||||
| Expt C |
3 peptides |
15 spectra |
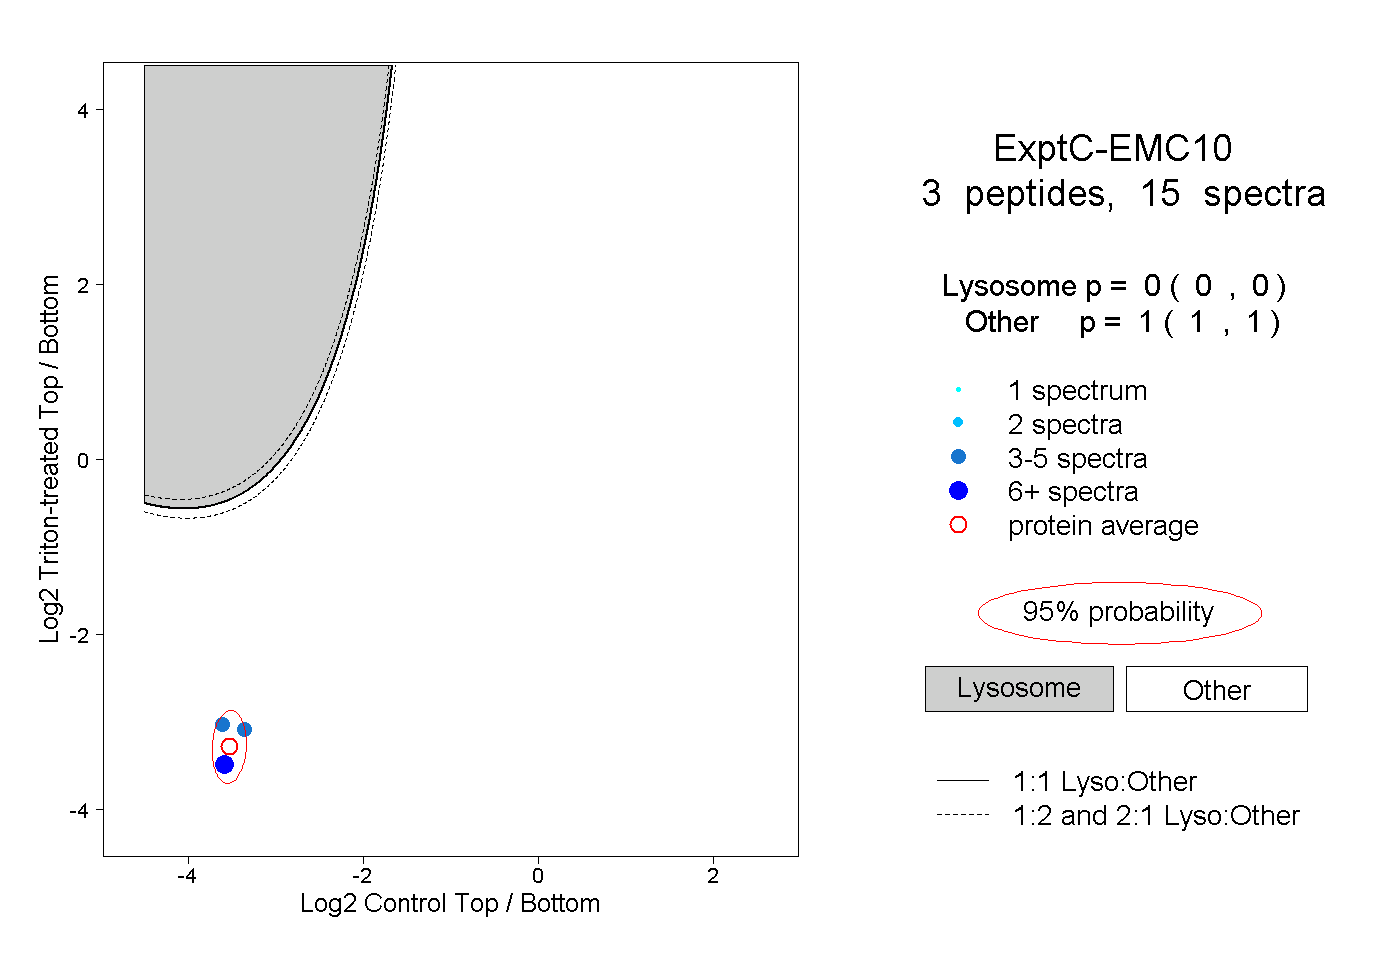 |
0.000 0.000 | 0.000 |
1.000 1.000 | 1.000 |
||||||||
| Plot | Lyso | Other | |||||||||||
| Expt D |
1 peptide |
1 spectrum |
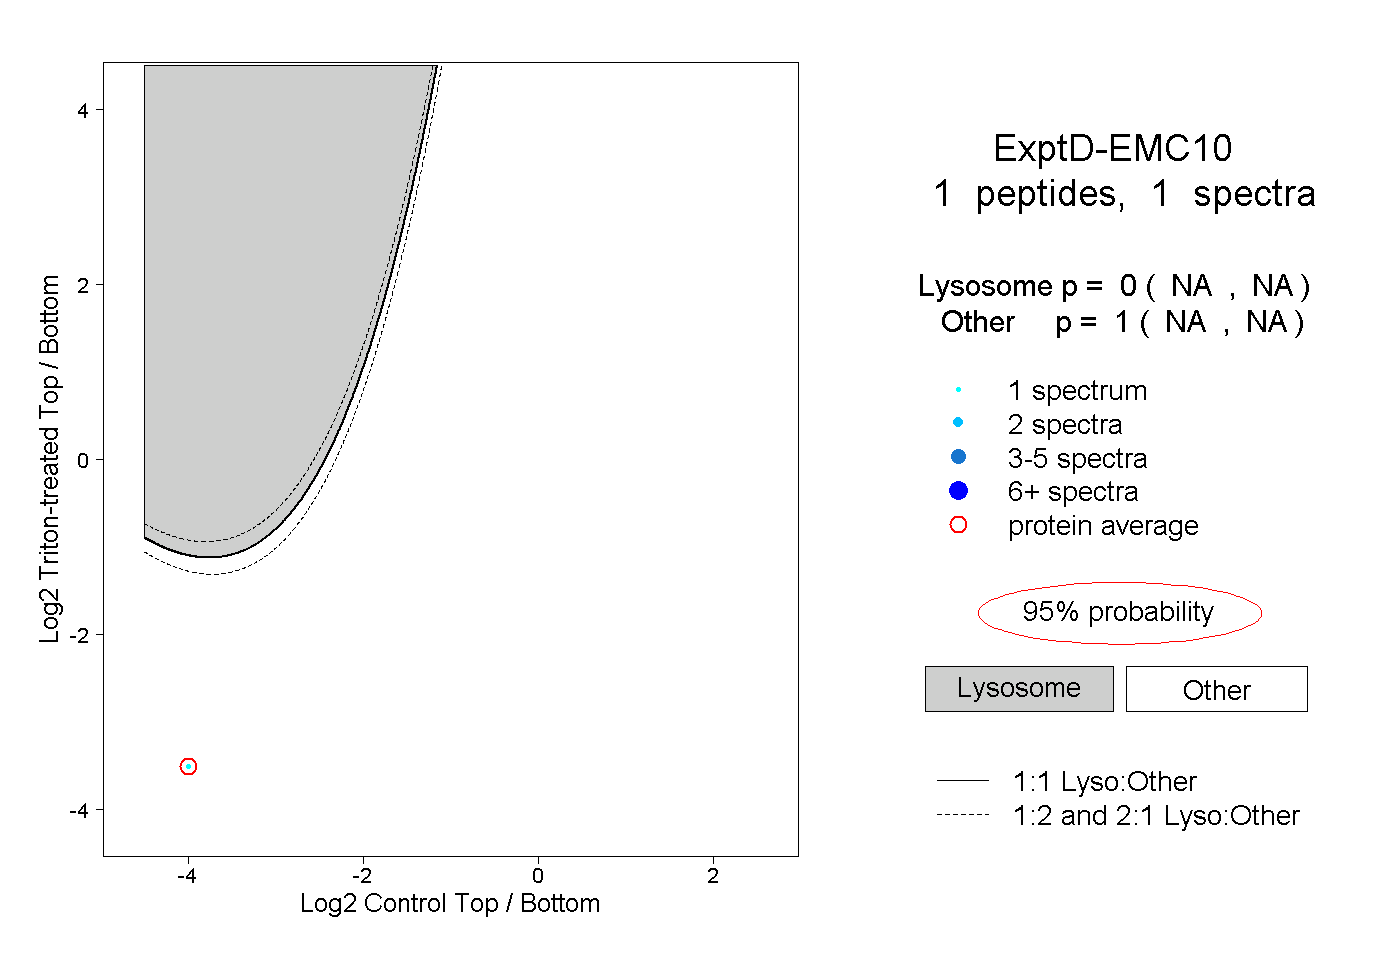 |
0.000 NA | NA |
1.000 NA | NA |