 4
4peptides
spectra
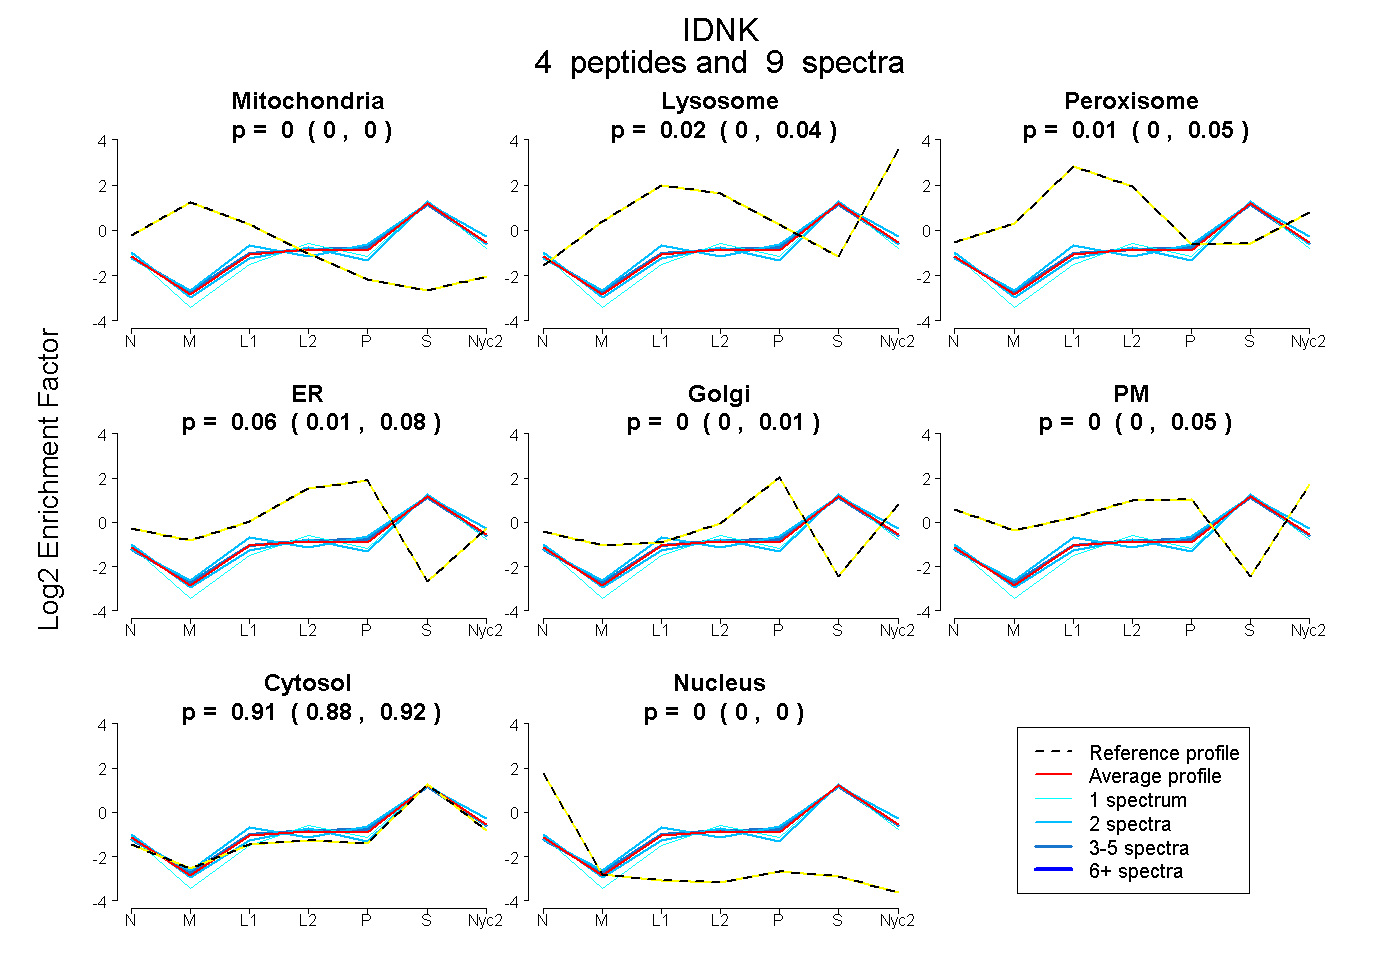
0.000 | 0.000
0.000 | 0.036
0.000 | 0.046
0.005 | 0.078
0.000 | 0.005
0.000 | 0.051
0.882 | 0.921
0.000 | 0.000
2peptides
spectra
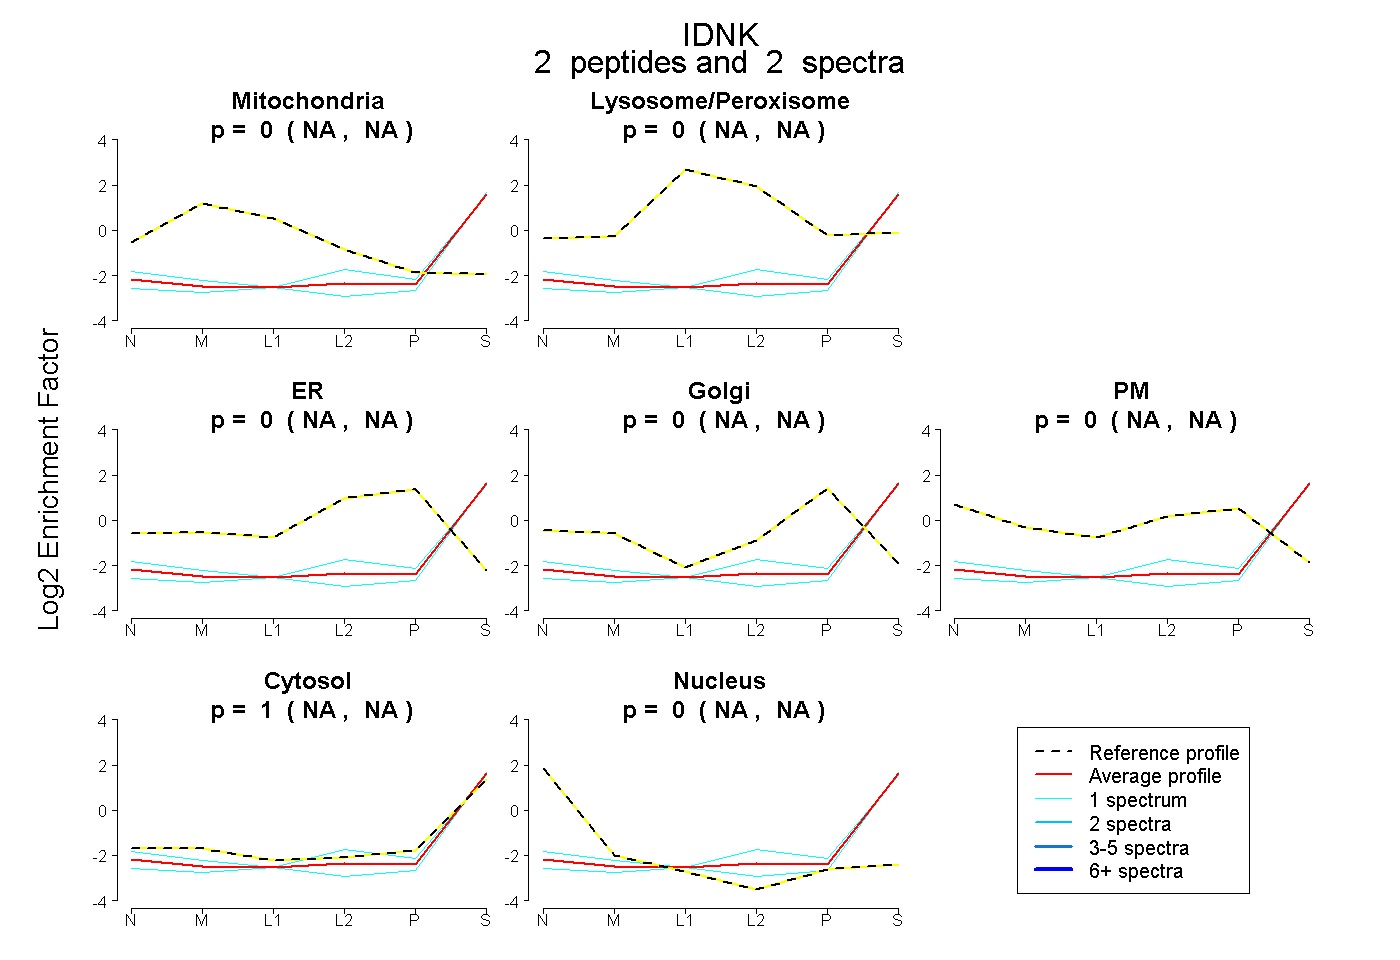
NA | NA
NA | NA
NA | NA
NA | NA
NA | NA
NA | NA
NA | NA
3peptides
spectra
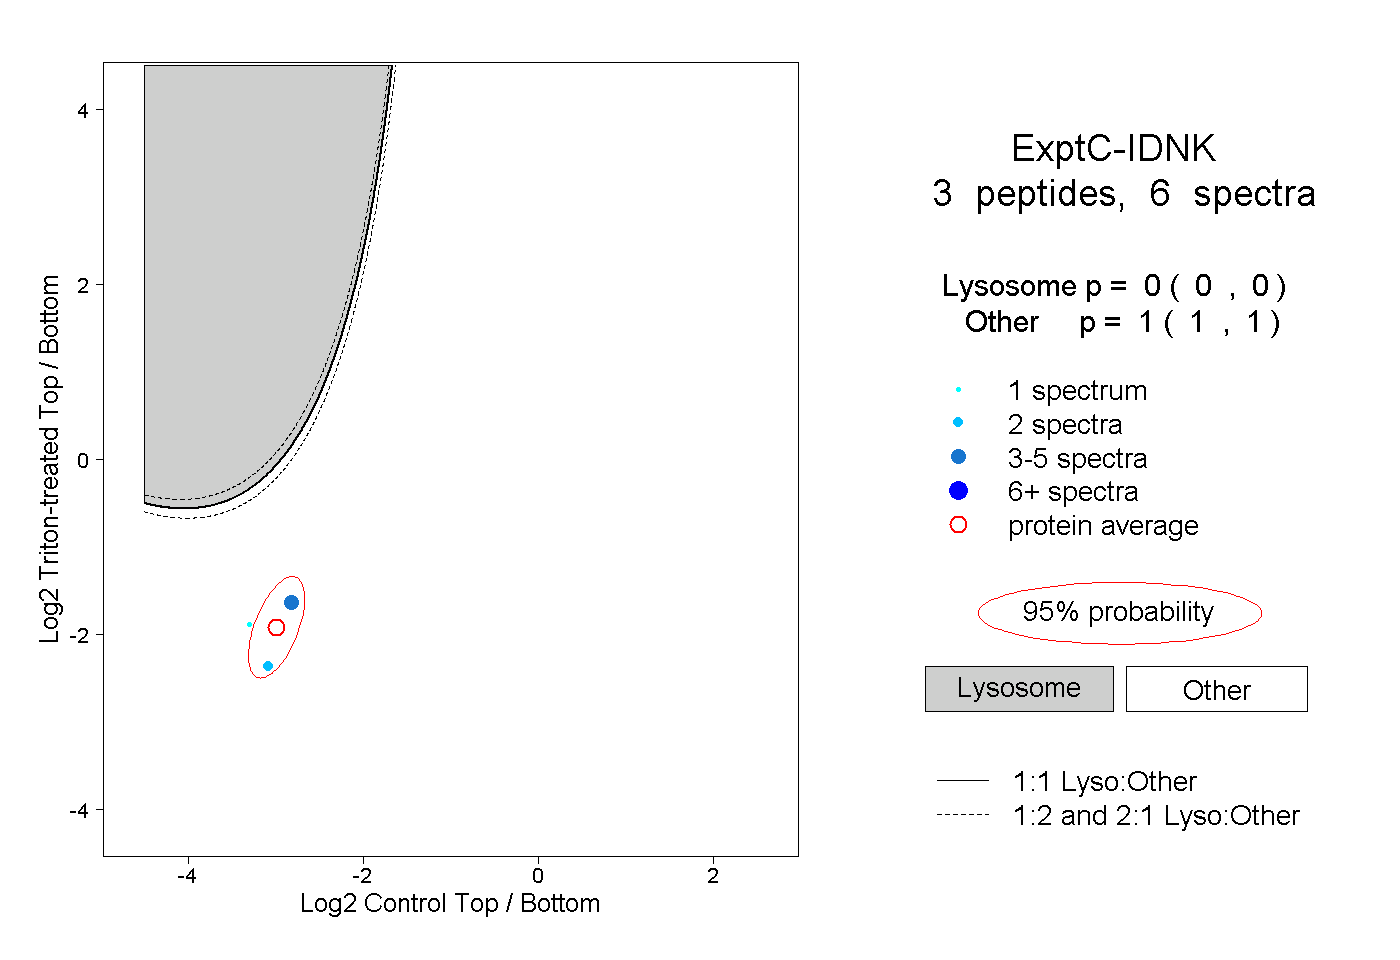
0.000 | 0.000
1.000 | 1.000