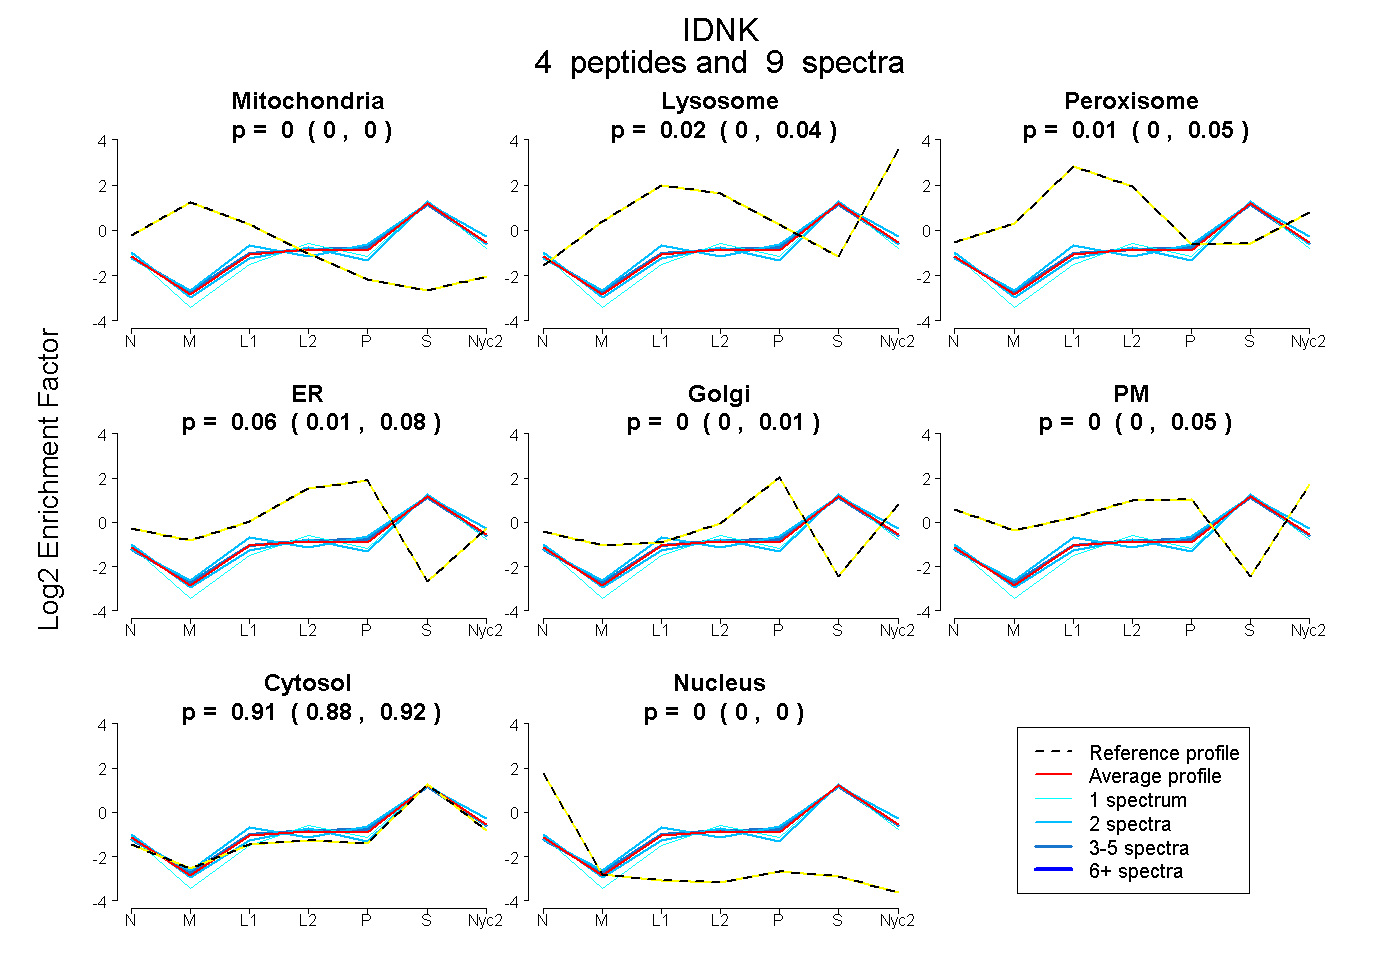
 4
4peptides
spectra
0.000 | 0.000
0.000 | 0.036
0.000 | 0.046
0.005 | 0.078
0.000 | 0.005
0.000 | 0.051
0.882 | 0.921
0.000 | 0.000
| Plot | Mito | Lyso | Perox | ER | Golgi | PM | Cytosol | Nucleus | |||||
| Expt A |
4 peptides |
9 spectra |
|
0.000 0.000 | 0.000 |
0.020 0.000 | 0.036 |
0.013 0.000 | 0.046 |
0.058 0.005 | 0.078 |
0.000 0.000 | 0.005 |
0.003 0.000 | 0.051 |
0.906 0.882 | 0.921 |
0.000 0.000 | 0.000 |
| 1 spectrum, GLPEIAAAVLEALK | 0.000 | 0.000 | 0.000 | 0.034 | 0.000 | 0.000 | 0.966 | 0.000 | ||
| 2 spectra, STVGALLANK | 0.000 | 0.077 | 0.012 | 0.000 | 0.052 | 0.000 | 0.859 | 0.000 | ||
| 4 spectra, FYDADDYHSEENR | 0.000 | 0.021 | 0.010 | 0.084 | 0.000 | 0.000 | 0.886 | 0.000 | ||
| 2 spectra, GVPLNDQDR | 0.000 | 0.000 | 0.021 | 0.000 | 0.000 | 0.034 | 0.945 | 0.000 |
| Plot | Mito | Lyso or Perox | ER | Golgi | PM | Cytosol | Nucleus | ||||||
| Expt B |
2 peptides |
2 spectra |
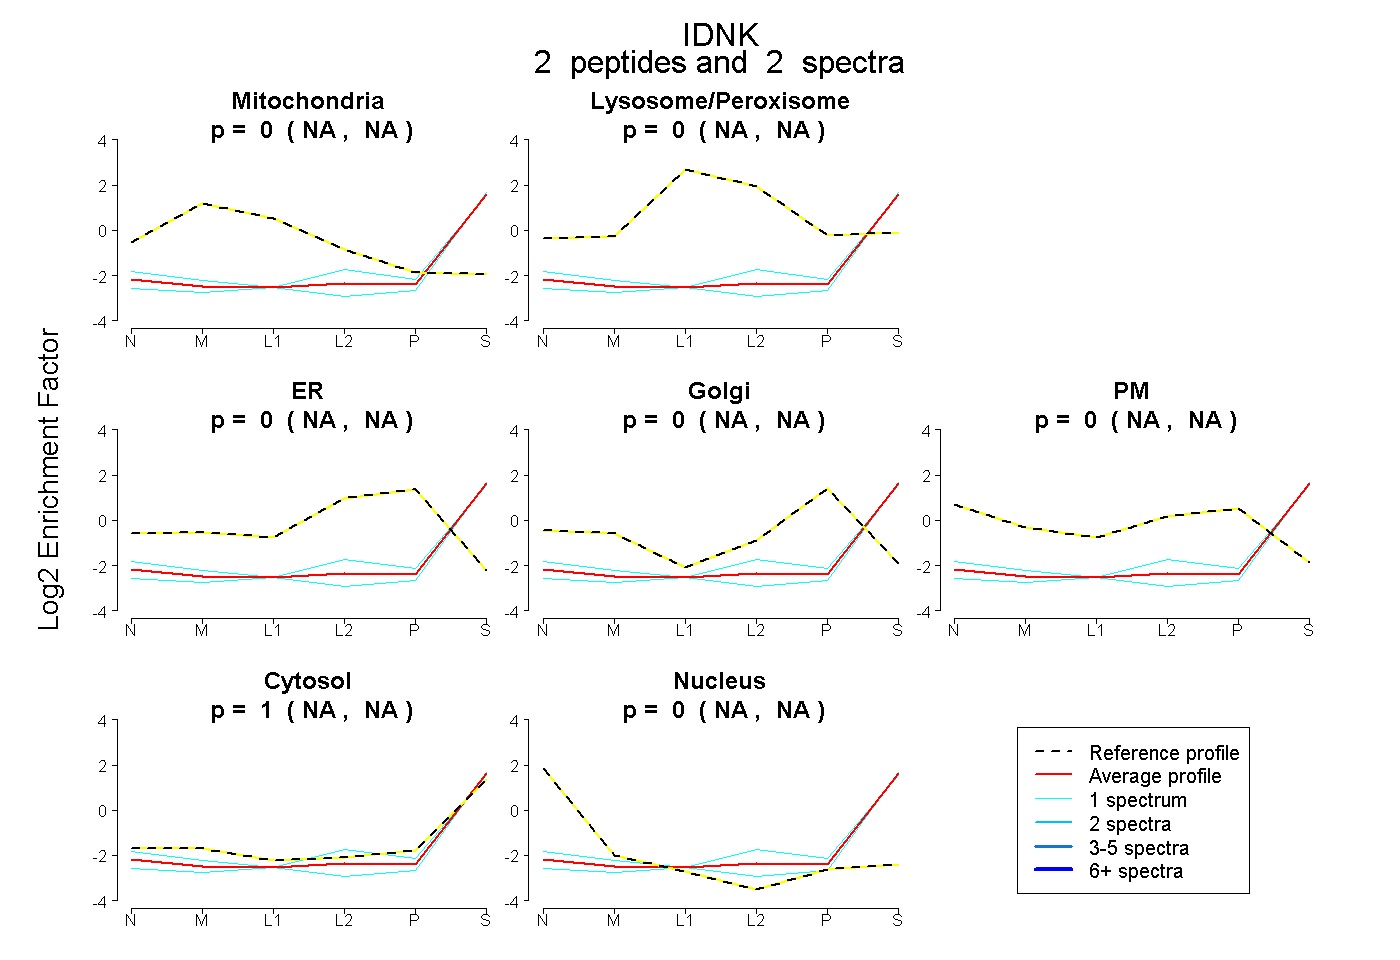 |
0.000 NA | NA |
0.000 NA | NA |
0.000 NA | NA |
0.000 NA | NA |
0.000 NA | NA |
1.000 NA | NA |
0.000 NA | NA |
|||
| Plot | Lyso | Other | |||||||||||
| Expt C |
3 peptides |
6 spectra |
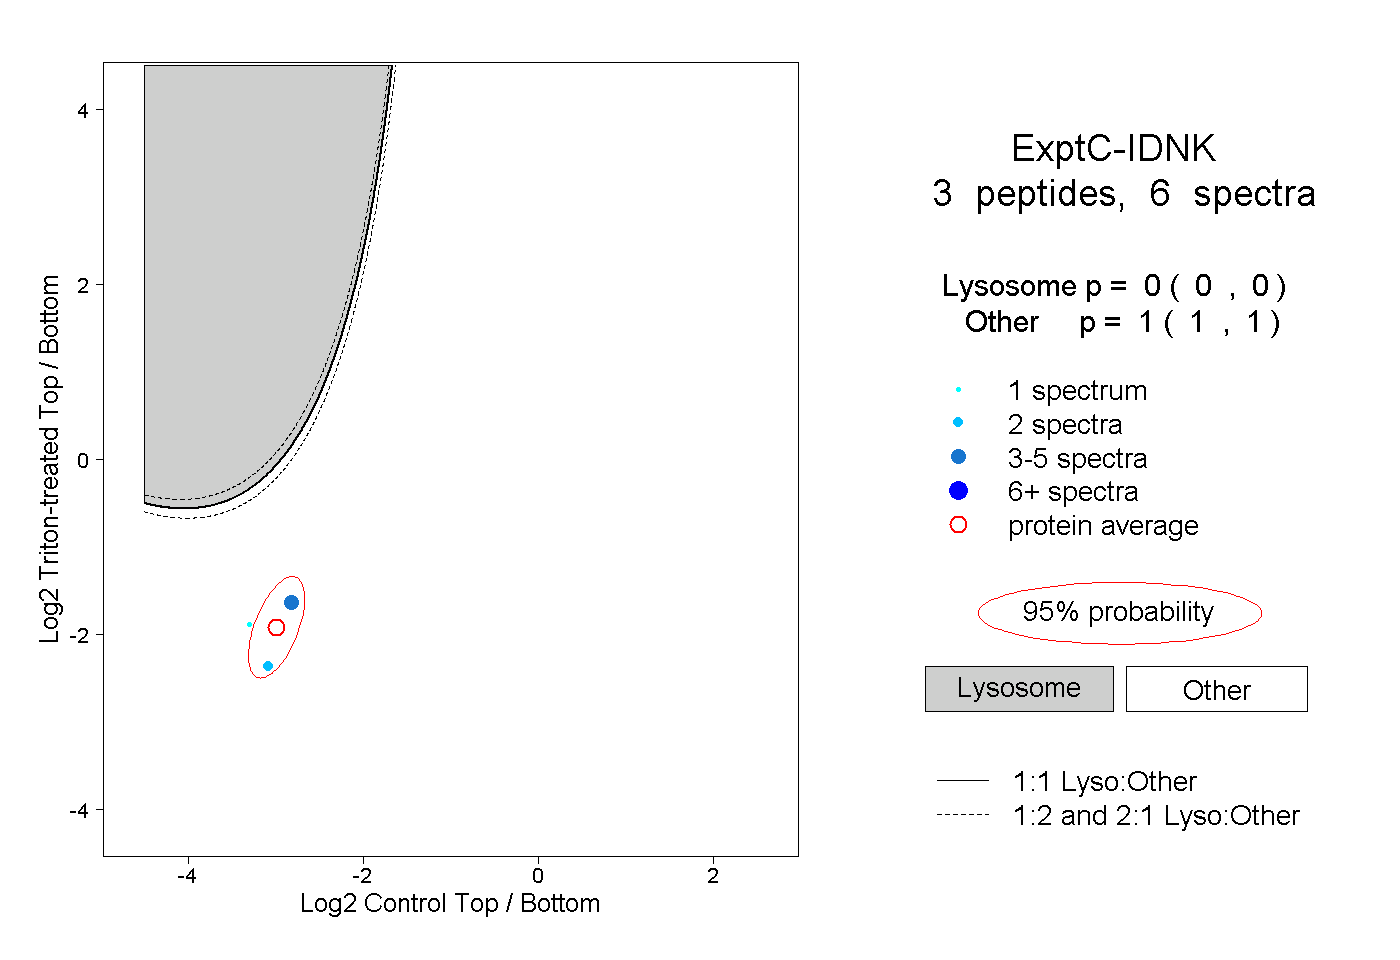 |
0.000 0.000 | 0.000 |
1.000 1.000 | 1.000 |