 16
16peptides
spectra
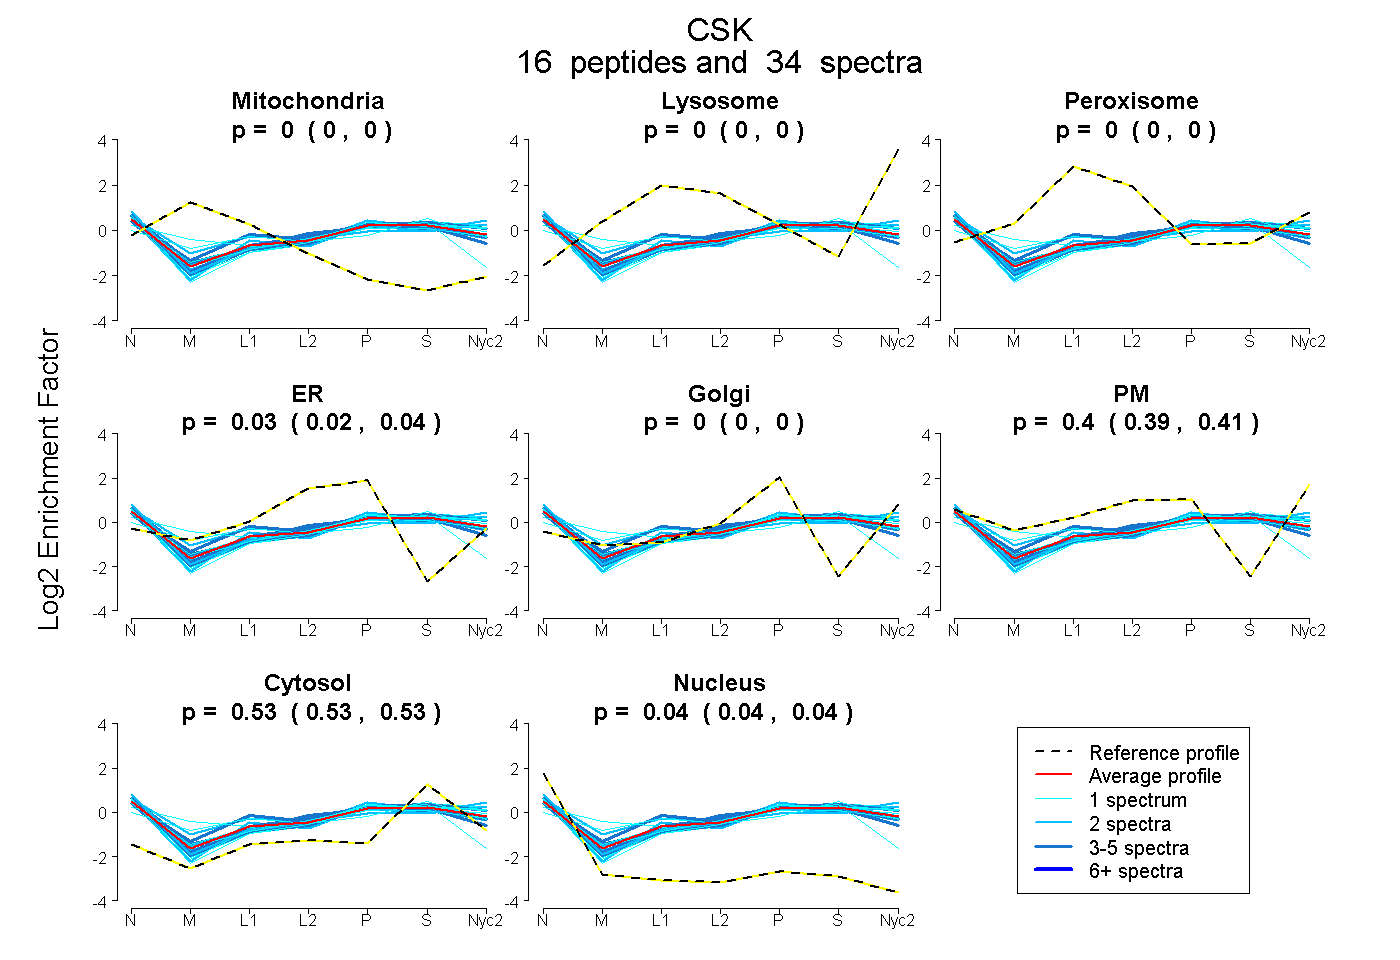
0.000 | 0.000
0.000 | 0.000
0.000 | 0.001
0.016 | 0.036
0.000 | 0.000
0.388 | 0.412
0.526 | 0.532
0.039 | 0.045
2peptides
spectra
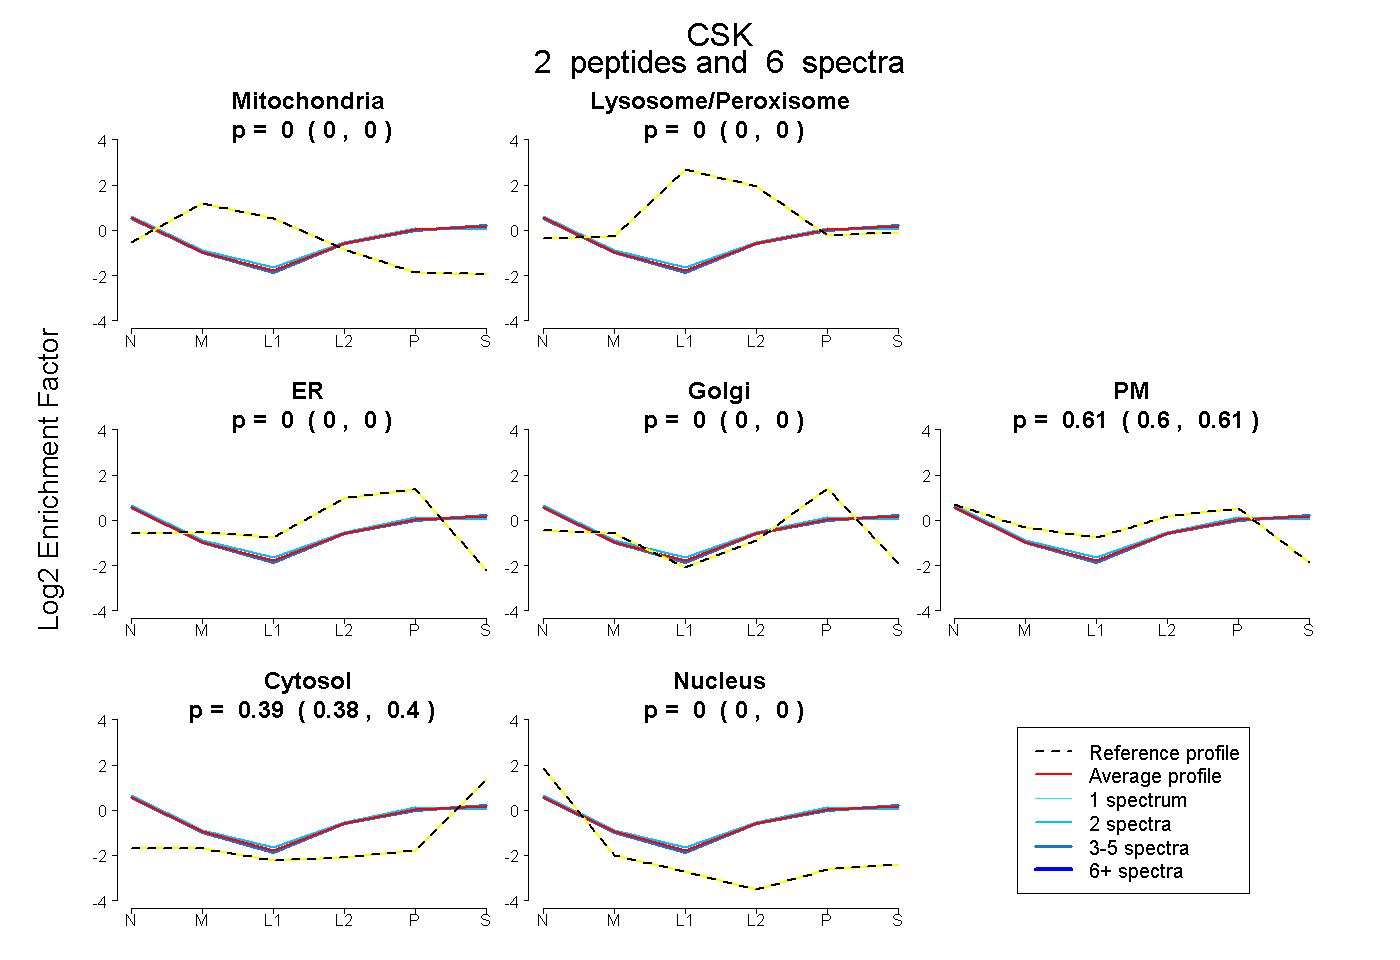
0.000 | 0.000
0.000 | 0.000
0.000 | 0.000
0.000 | 0.000
0.596 | 0.615
0.384 | 0.403
0.000 | 0.000
13peptides
spectra
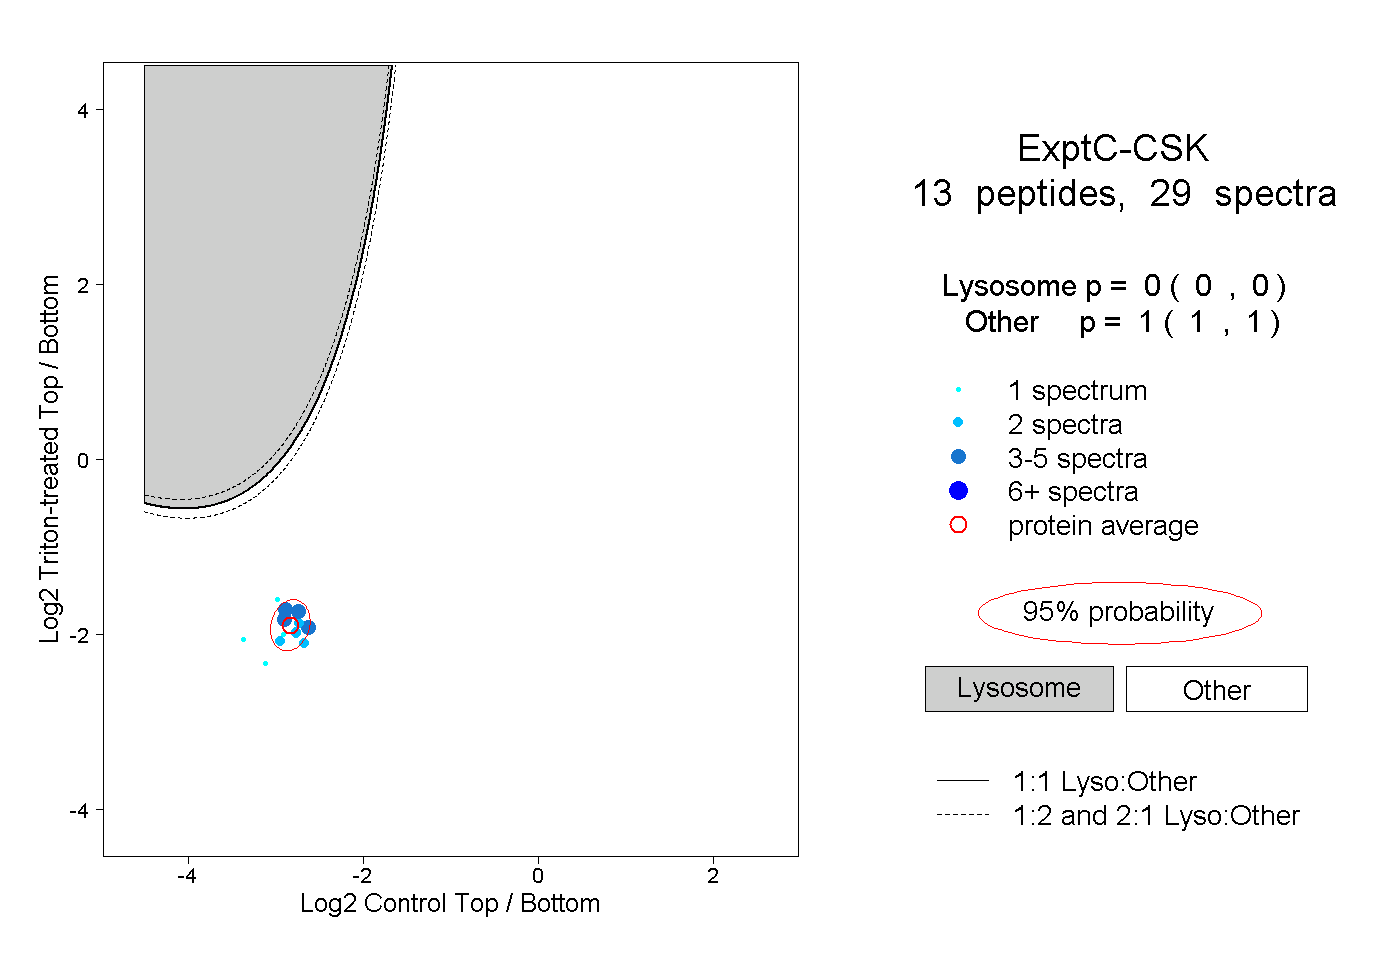
0.000 | 0.000
1.000 | 1.000
3peptides
spectra
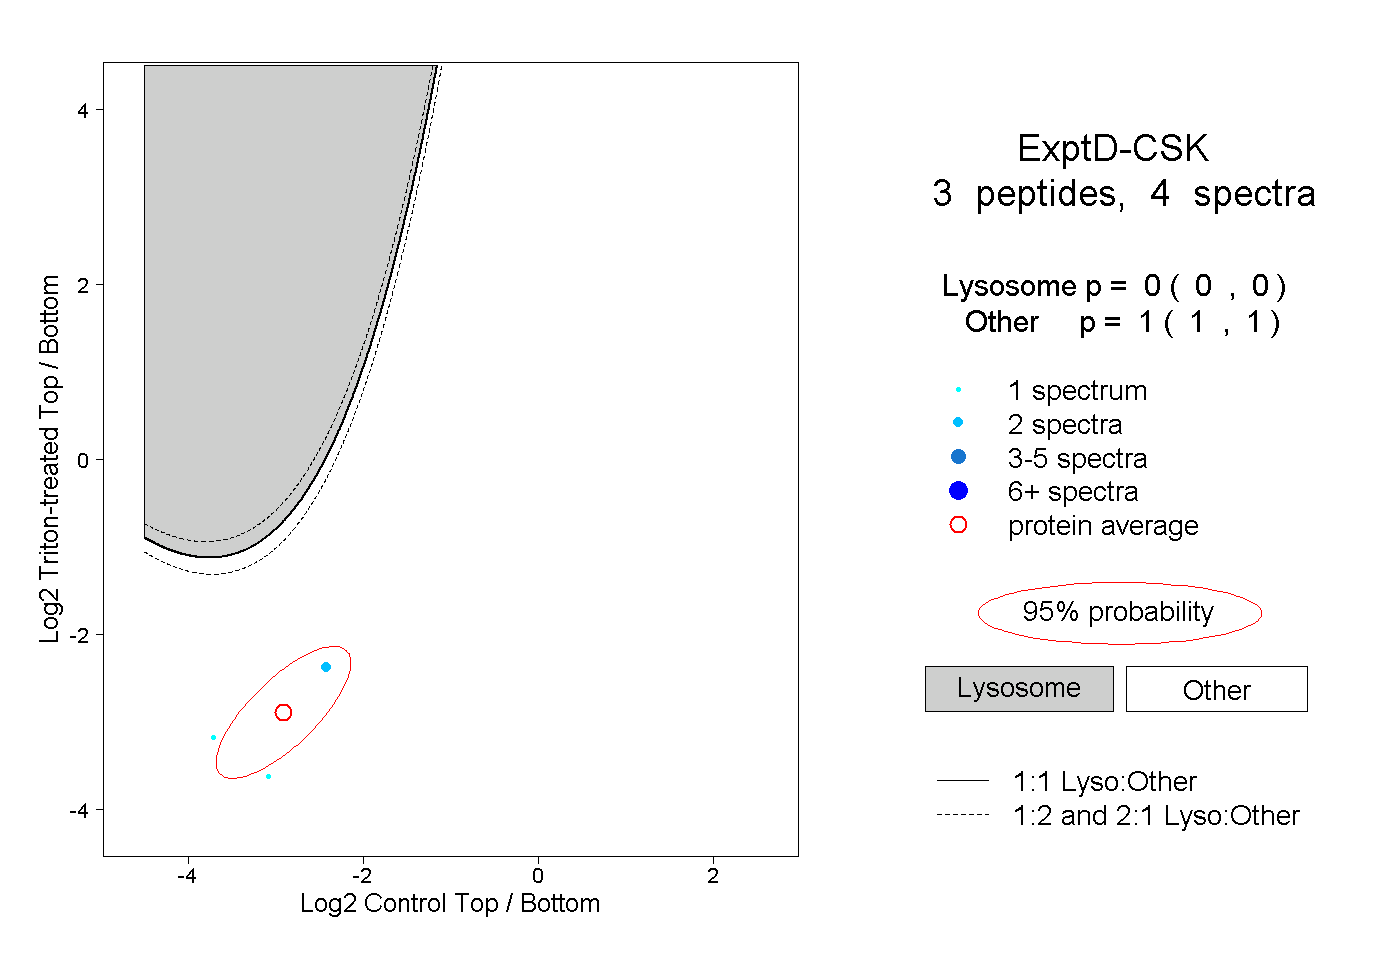
0.000 | 0.000
1.000 | 1.000