 16
16peptides
spectra
0.000 | 0.000
0.000 | 0.000
0.000 | 0.001
0.016 | 0.036
0.000 | 0.000
0.388 | 0.412
0.526 | 0.532
0.039 | 0.045
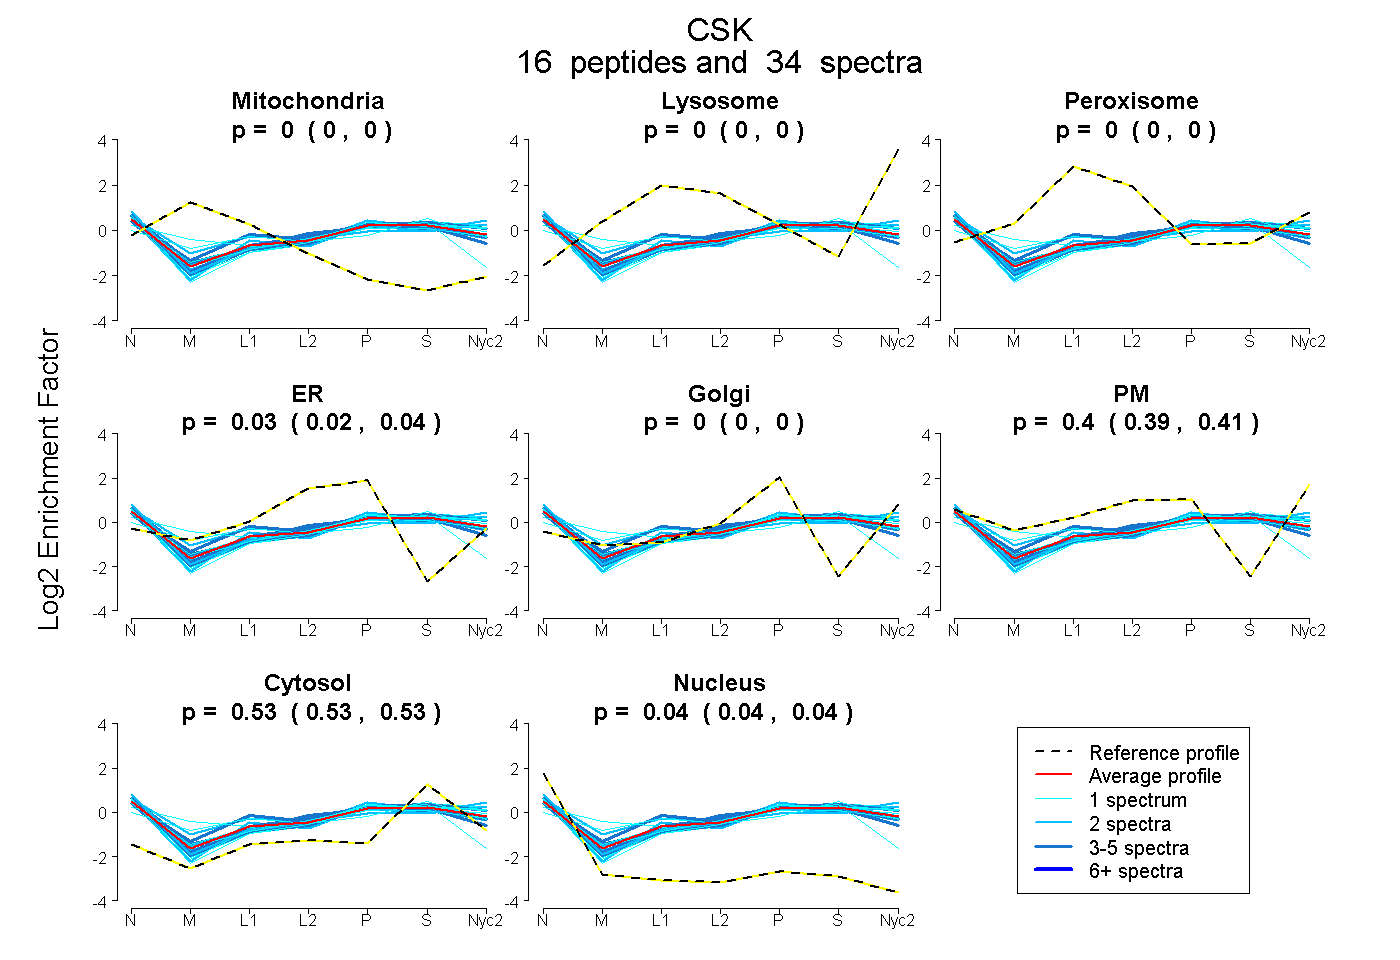
| Plot | Mito | Lyso | Perox | ER | Golgi | PM | Cytosol | Nucleus | |||||
| Expt A |
16 peptides |
34 spectra |
|
0.000 0.000 | 0.000 |
0.000 0.000 | 0.000 |
0.000 0.000 | 0.001 |
0.027 0.016 | 0.036 |
0.000 0.000 | 0.000 |
0.401 0.388 | 0.412 |
0.530 0.526 | 0.532 |
0.042 0.039 | 0.045 |
| 1 spectrum, SVLGGDCLLK | 0.000 | 0.000 | 0.000 | 0.310 | 0.000 | 0.000 | 0.538 | 0.153 | ||
| 2 spectra, VMEGTVAAQDEFYR | 0.000 | 0.000 | 0.000 | 0.000 | 0.000 | 0.469 | 0.464 | 0.067 | ||
| 2 spectra, EGIIPANYVQK | 0.000 | 0.000 | 0.000 | 0.051 | 0.000 | 0.326 | 0.574 | 0.048 | ||
| 1 spectrum, WTAPEAIR | 0.000 | 0.000 | 0.000 | 0.000 | 0.000 | 0.446 | 0.537 | 0.017 | ||
| 2 spectra, GEFGDVMLGDYR | 0.000 | 0.000 | 0.000 | 0.017 | 0.000 | 0.392 | 0.557 | 0.034 | ||
| 1 spectrum, NVLVSEDNVAK | 0.132 | 0.000 | 0.022 | 0.000 | 0.015 | 0.372 | 0.459 | 0.000 | ||
| 5 spectra, MDAPDGCPPAVYDVMK | 0.000 | 0.000 | 0.158 | 0.135 | 0.000 | 0.182 | 0.447 | 0.079 | ||
| 4 spectra, LLYPPETGLFLVR | 0.000 | 0.000 | 0.000 | 0.031 | 0.012 | 0.352 | 0.527 | 0.077 | ||
| 2 spectra, GGLYIVTEYMAK | 0.000 | 0.000 | 0.088 | 0.000 | 0.000 | 0.449 | 0.428 | 0.035 | ||
| 4 spectra, LSLMPWFHGK | 0.000 | 0.000 | 0.000 | 0.005 | 0.000 | 0.431 | 0.564 | 0.000 | ||
| 1 spectrum, EASSTQDTGK | 0.000 | 0.000 | 0.000 | 0.000 | 0.061 | 0.346 | 0.579 | 0.015 | ||
| 1 spectrum, YNFHGTAEQDLPFCK | 0.066 | 0.000 | 0.152 | 0.000 | 0.000 | 0.243 | 0.539 | 0.000 | ||
| 2 spectra, GSLVDYLR | 0.000 | 0.000 | 0.000 | 0.069 | 0.086 | 0.284 | 0.498 | 0.063 | ||
| 4 spectra, EQLEHIR | 0.000 | 0.000 | 0.013 | 0.067 | 0.000 | 0.382 | 0.473 | 0.065 | ||
| 1 spectrum, THELHL | 0.000 | 0.000 | 0.000 | 0.000 | 0.033 | 0.395 | 0.519 | 0.052 | ||
| 1 spectrum, SGWALNMK | 0.000 | 0.000 | 0.000 | 0.000 | 0.012 | 0.447 | 0.529 | 0.012 |
| Plot | Mito | Lyso or Perox | ER | Golgi | PM | Cytosol | Nucleus | ||||||
| Expt B |
2 peptides |
6 spectra |
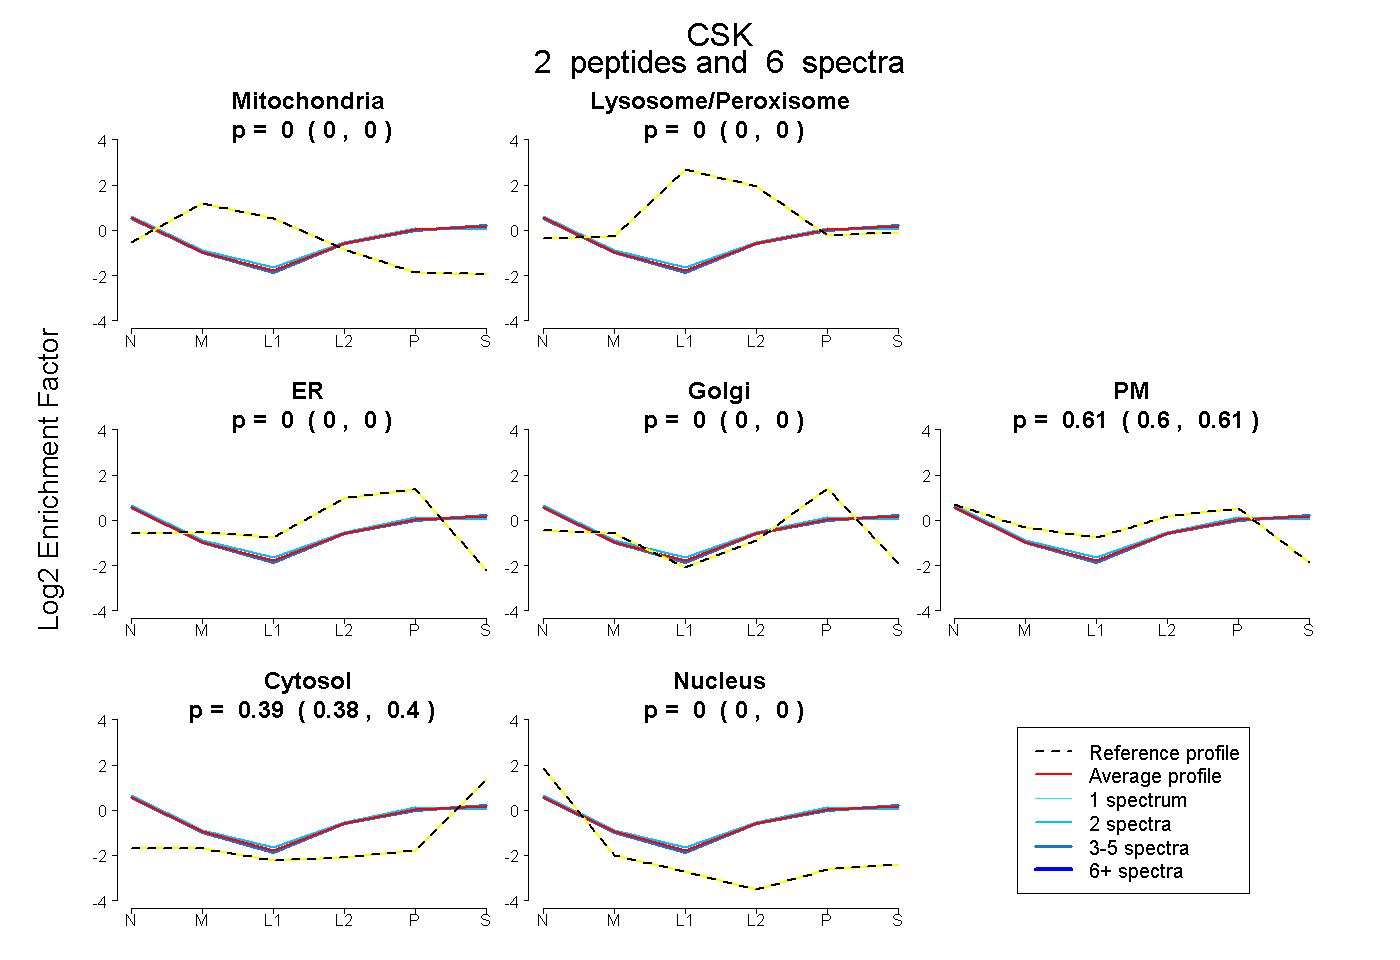 |
0.000 0.000 | 0.000 |
0.000 0.000 | 0.000 |
0.000 0.000 | 0.000 |
0.000 0.000 | 0.000 |
0.606 0.596 | 0.615 |
0.394 0.384 | 0.403 |
0.000 0.000 | 0.000 |
|||
| Plot | Lyso | Other | |||||||||||
| Expt C |
13 peptides |
29 spectra |
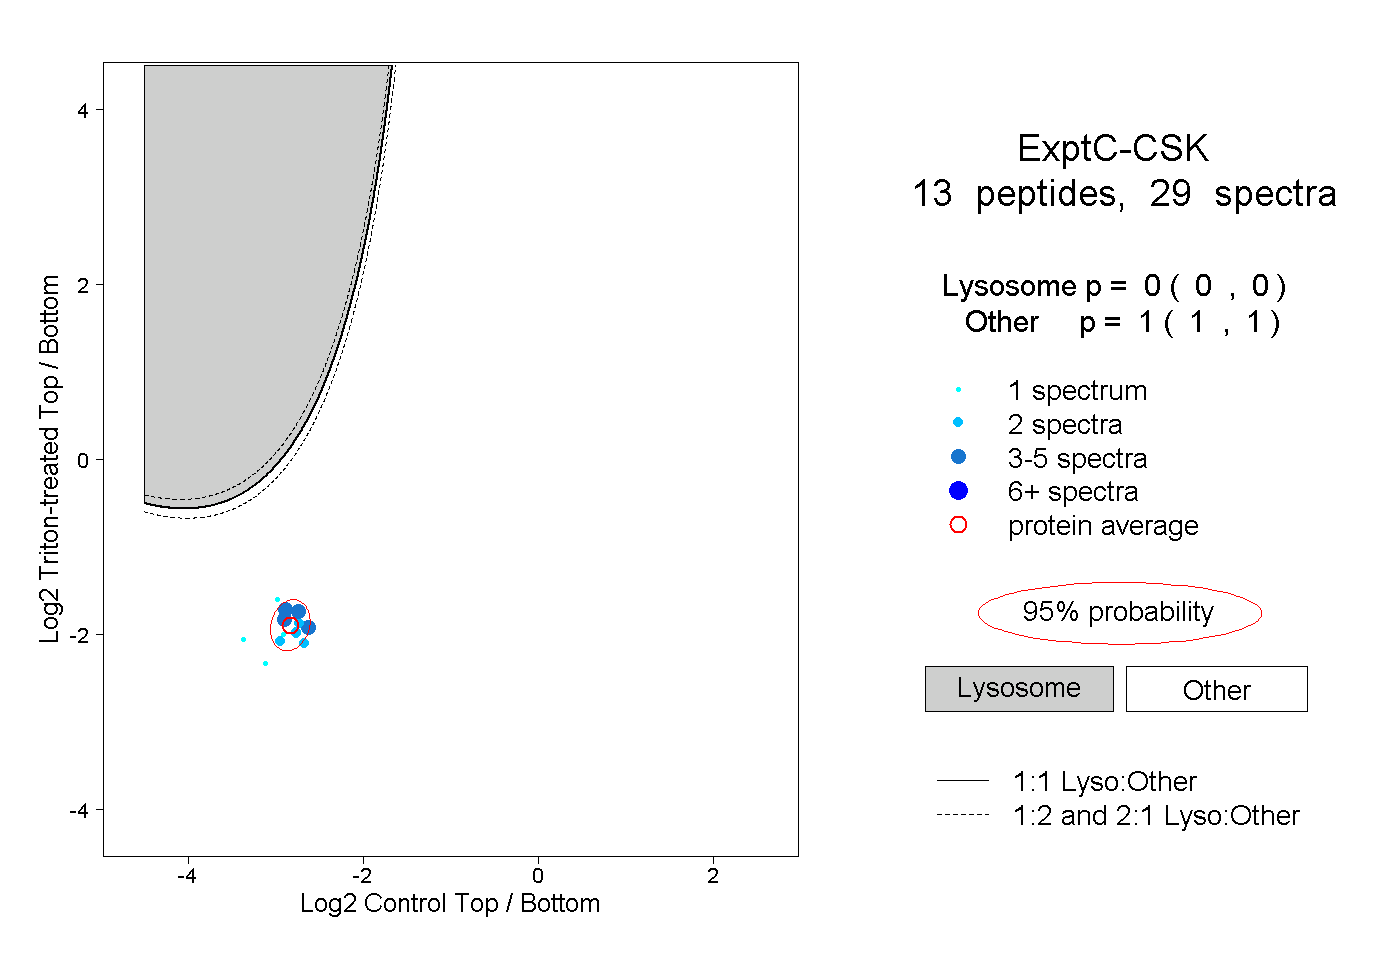 |
0.000 0.000 | 0.000 |
1.000 1.000 | 1.000 |
||||||||
| Plot | Lyso | Other | |||||||||||
| Expt D |
3 peptides |
4 spectra |
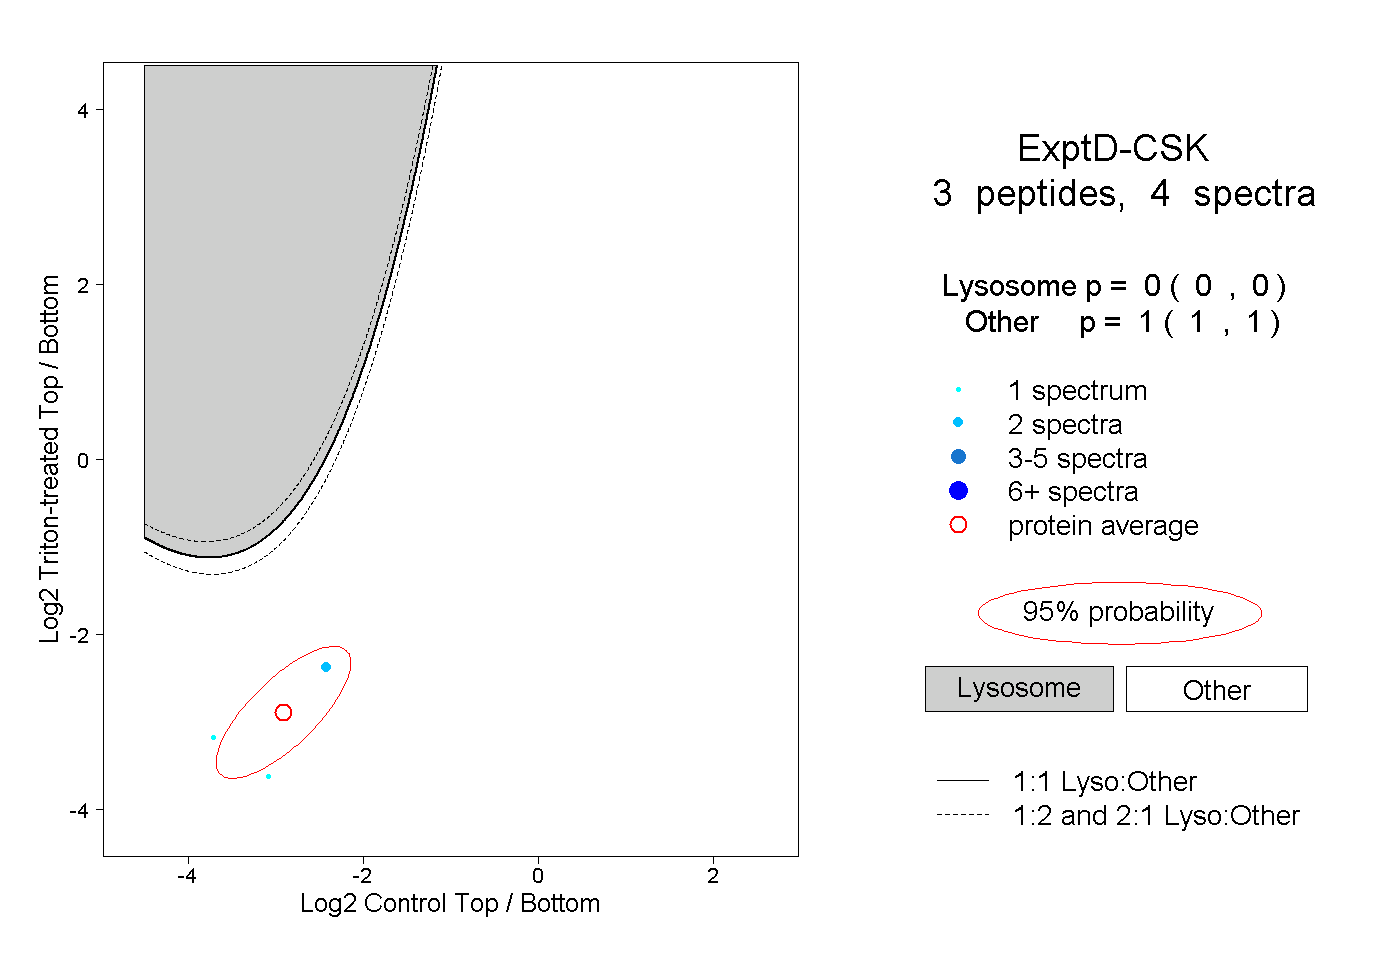 |
0.000 0.000 | 0.000 |
1.000 1.000 | 1.000 |