 5
5peptides
spectra
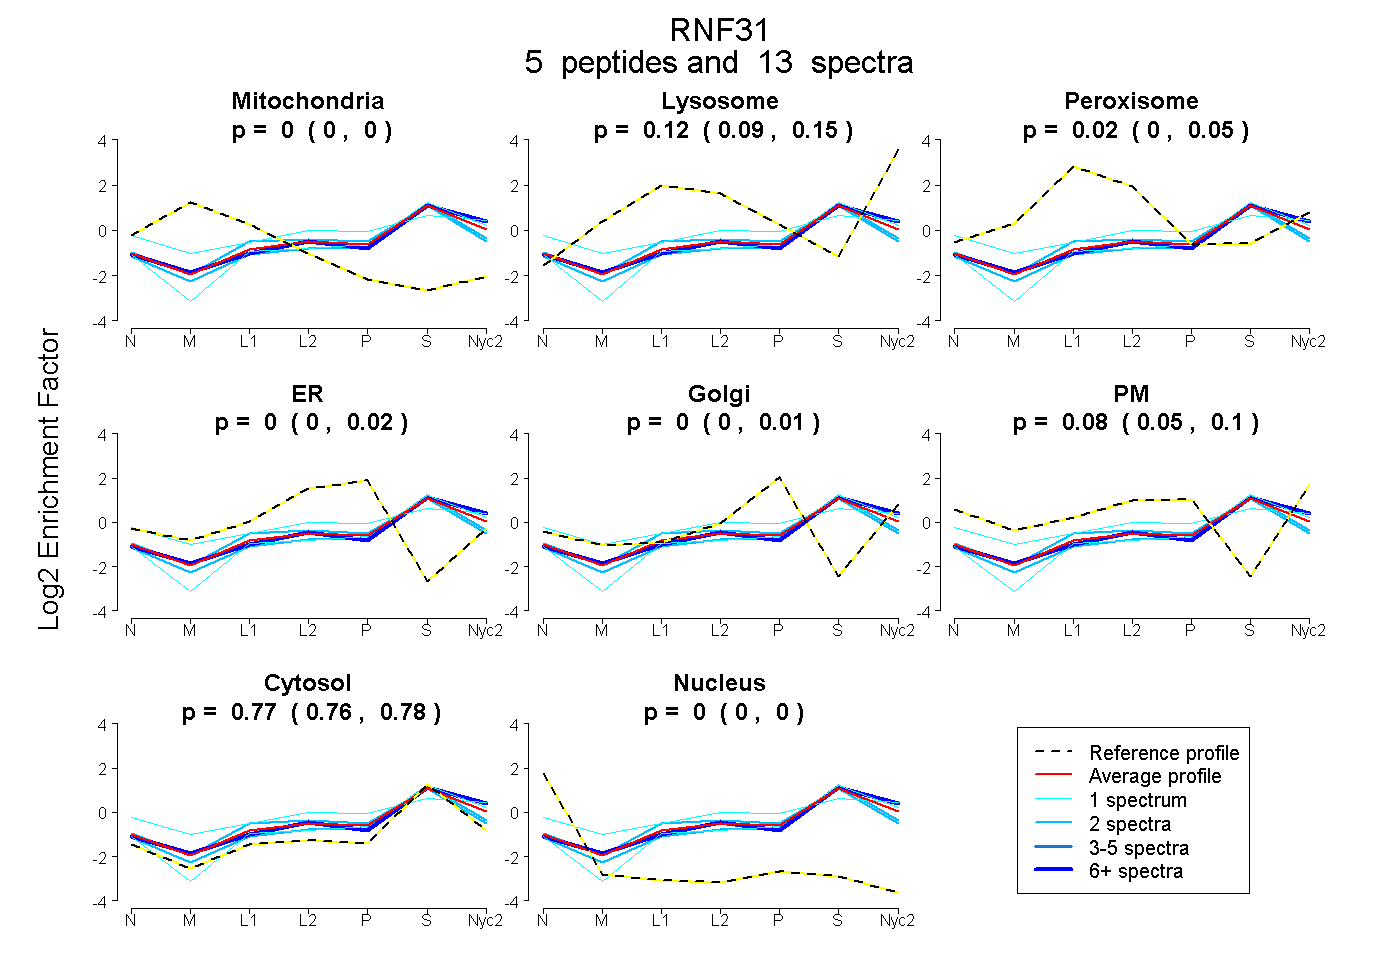
0.000 | 0.000
0.088 | 0.148
0.000 | 0.050
0.000 | 0.017
0.000 | 0.011
0.054 | 0.095
0.760 | 0.781
0.000 | 0.000
1peptide
spectrum
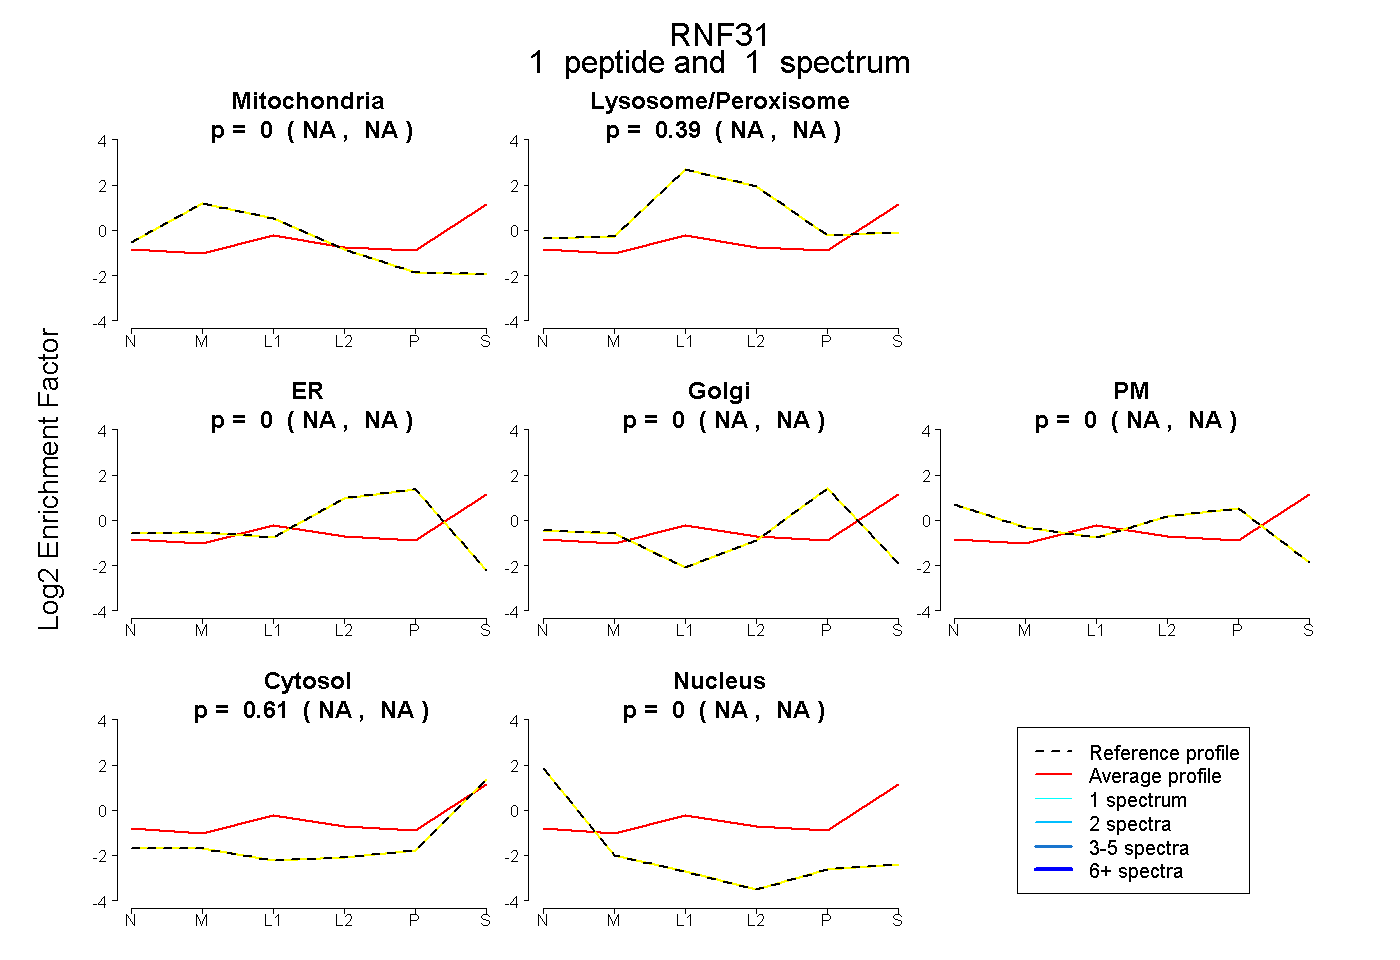
NA | NA
NA | NA
NA | NA
NA | NA
NA | NA
NA | NA
NA | NA
1peptide
spectra
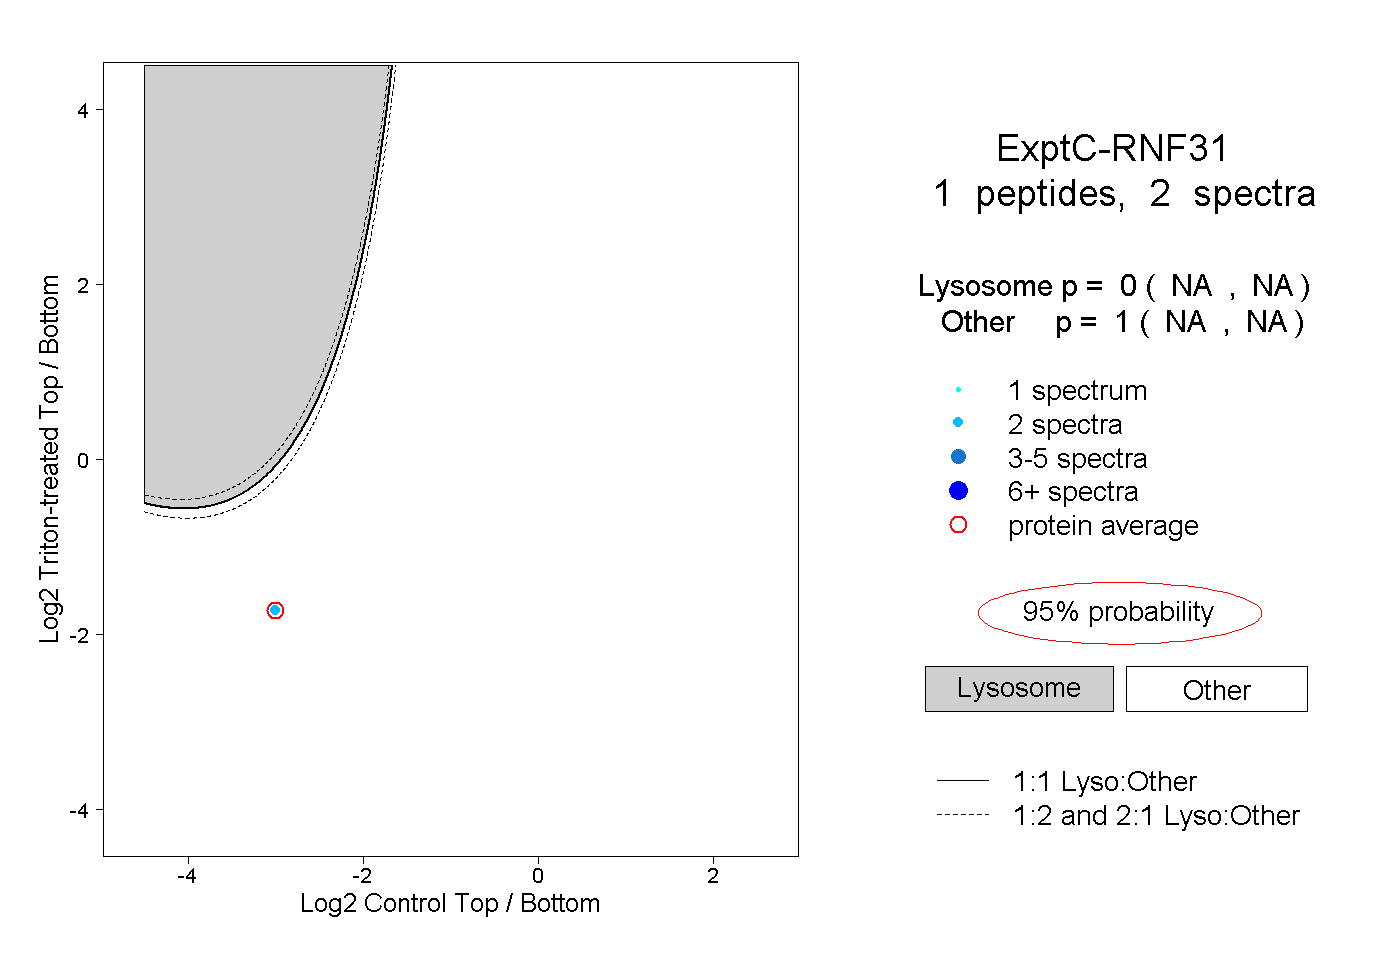
NA | NA
NA | NA