 5
5peptides
spectra
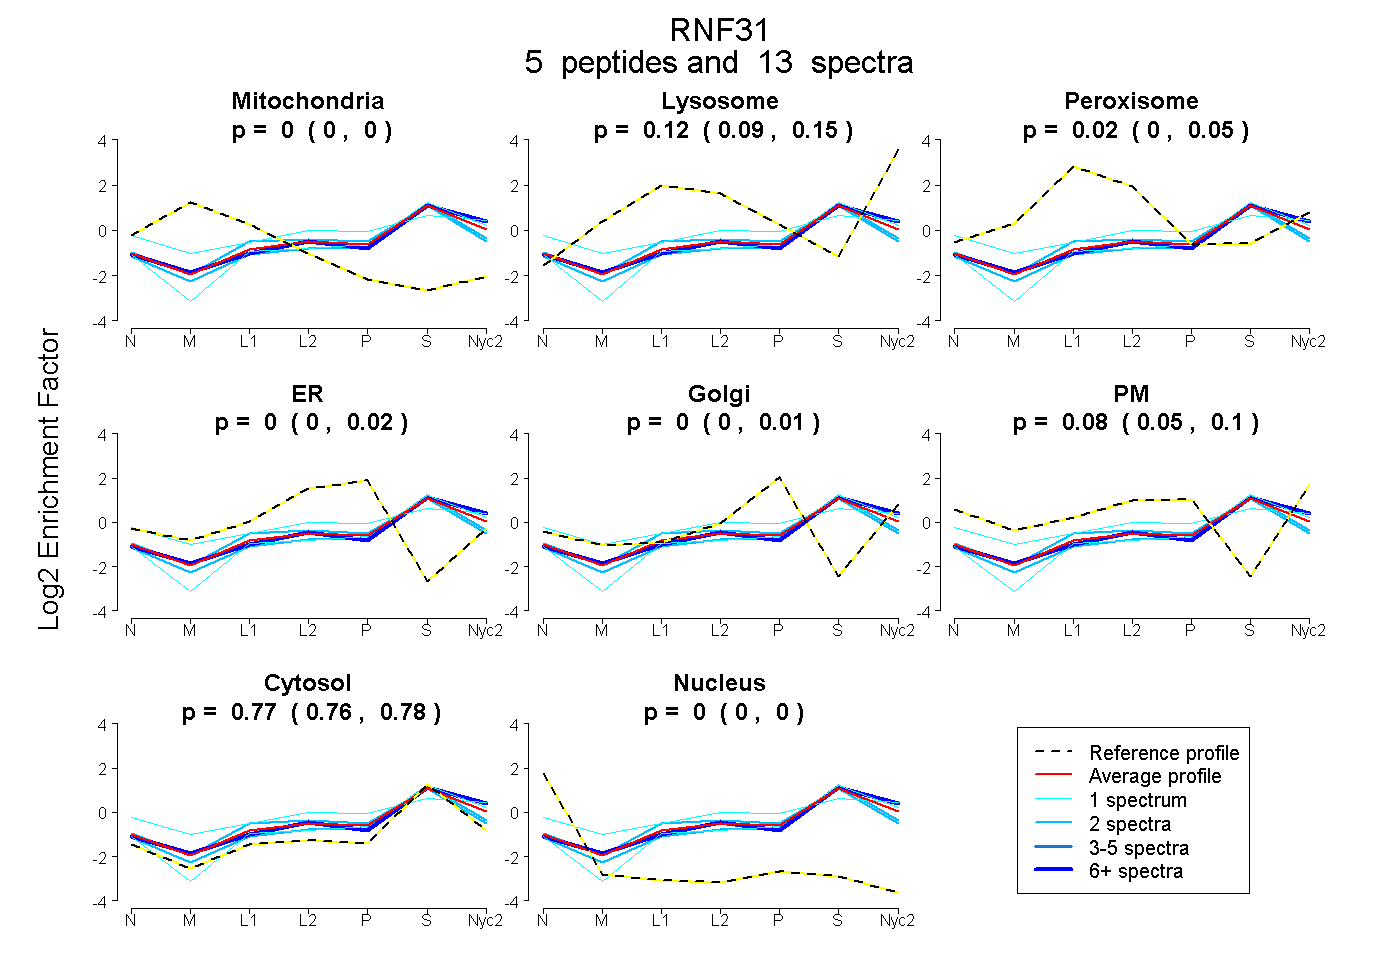
0.000 | 0.000
0.088 | 0.148
0.000 | 0.050
0.000 | 0.017
0.000 | 0.011
0.054 | 0.095
0.760 | 0.781
0.000 | 0.000
| Plot | Mito | Lyso | Perox | ER | Golgi | PM | Cytosol | Nucleus | |||||
| Expt A |
5 peptides |
13 spectra |
|
0.000 0.000 | 0.000 |
0.121 0.088 | 0.148 |
0.024 0.000 | 0.050 |
0.000 0.000 | 0.017 |
0.000 0.000 | 0.011 |
0.084 0.054 | 0.095 |
0.772 0.760 | 0.781 |
0.000 0.000 | 0.000 |
| 1 spectrum, STVDAVQGGR | 0.000 | 0.099 | 0.000 | 0.000 | 0.052 | 0.000 | 0.849 | 0.000 | ||
| 2 spectra, HGNLDEAVEECVR | 0.000 | 0.000 | 0.176 | 0.088 | 0.000 | 0.000 | 0.736 | 0.000 | ||
| 1 spectrum, SPIPAQPYPSSLEK | 0.000 | 0.034 | 0.120 | 0.000 | 0.000 | 0.308 | 0.538 | 0.000 | ||
| 2 spectra, AVPGGGCR | 0.000 | 0.064 | 0.017 | 0.026 | 0.030 | 0.012 | 0.852 | 0.000 | ||
| 7 spectra, NLLSPQRPR | 0.000 | 0.194 | 0.000 | 0.000 | 0.000 | 0.035 | 0.771 | 0.000 |
| Plot | Mito | Lyso or Perox | ER | Golgi | PM | Cytosol | Nucleus | ||||||
| Expt B |
1 peptide |
1 spectrum |
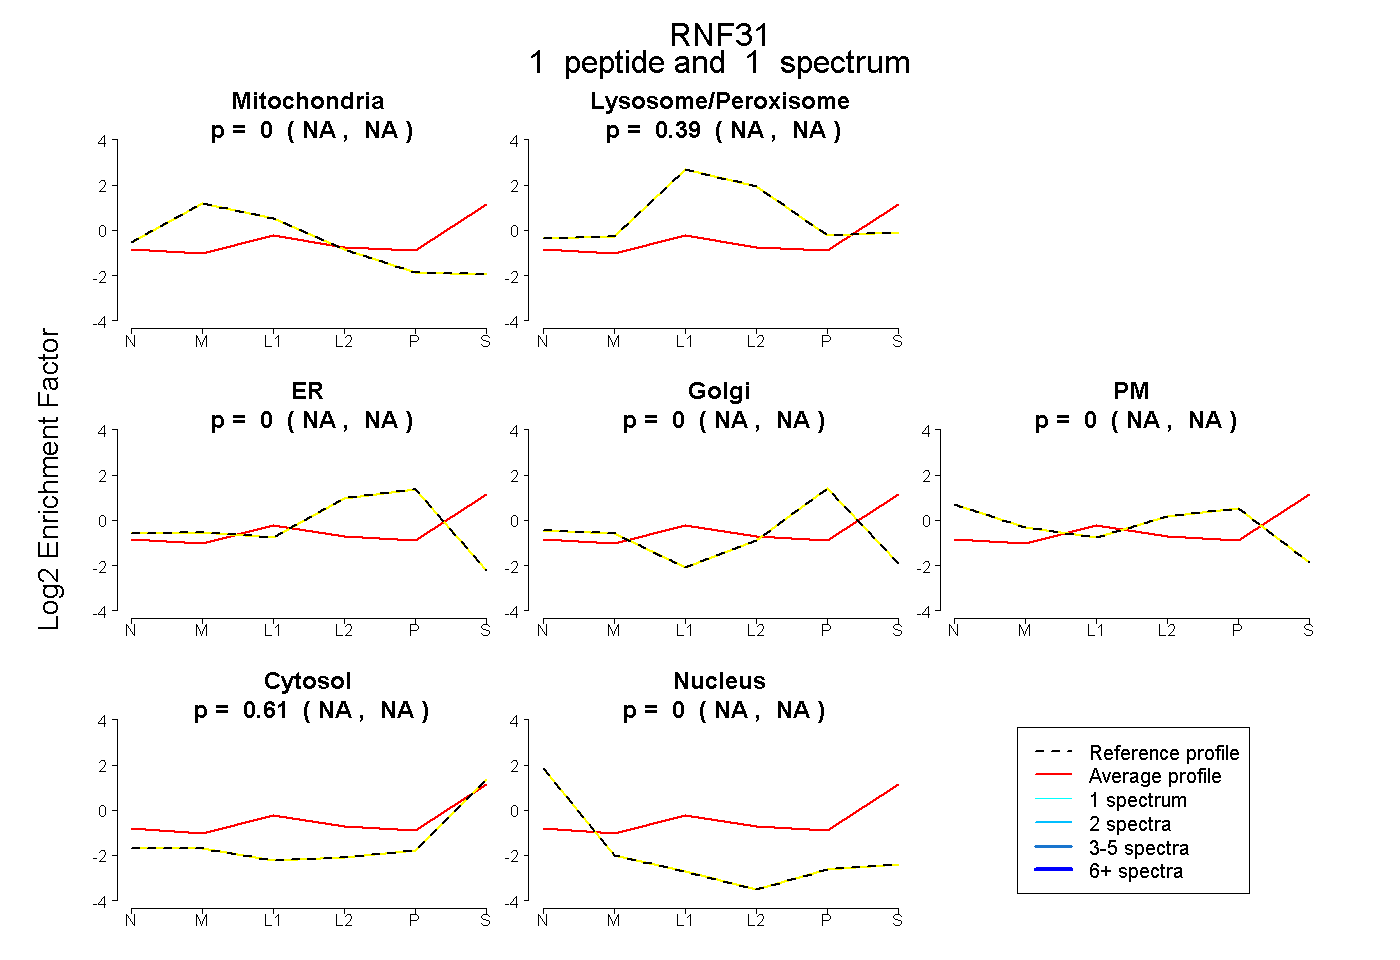 |
0.000 NA | NA |
0.388 NA | NA |
0.000 NA | NA |
0.000 NA | NA |
0.004 NA | NA |
0.608 NA | NA |
0.000 NA | NA |
|||
| Plot | Lyso | Other | |||||||||||
| Expt C |
1 peptide |
2 spectra |
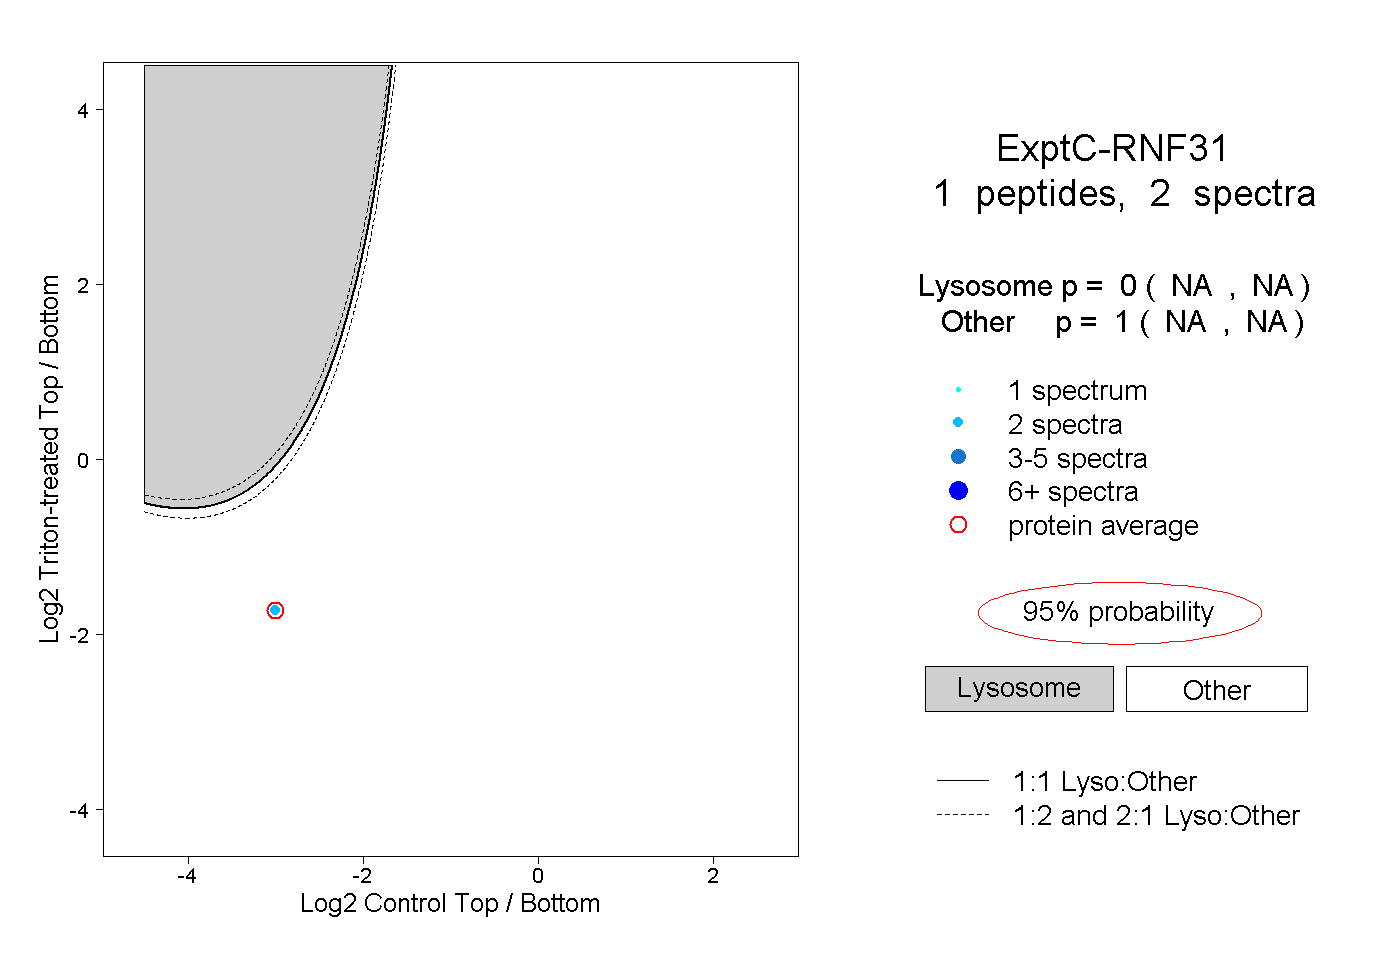 |
0.000 NA | NA |
1.000 NA | NA |