 12
12peptides
spectra
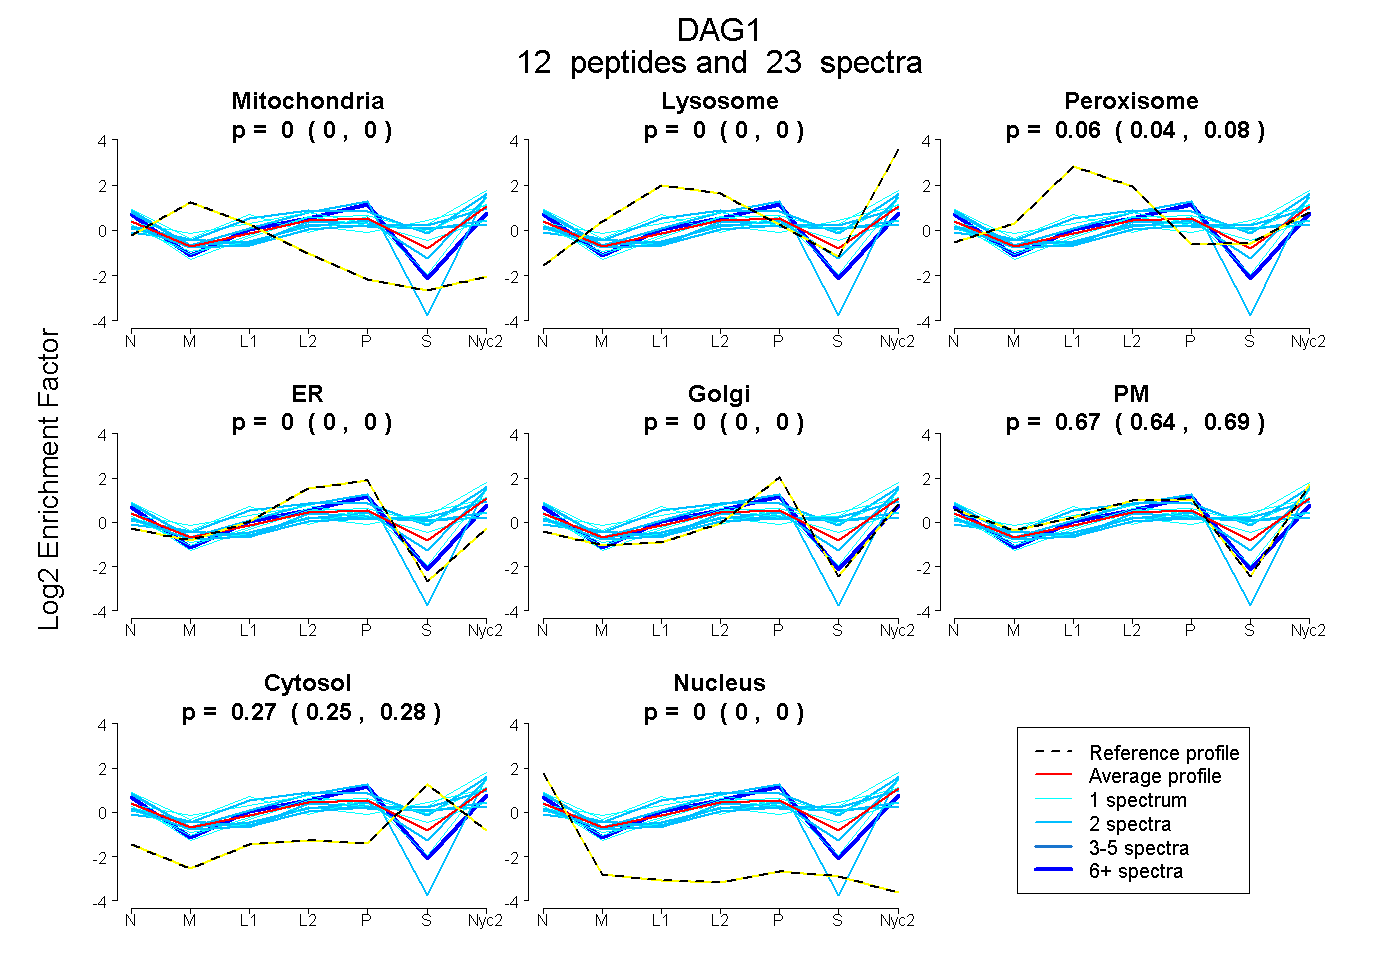
0.000 | 0.000
0.000 | 0.000
0.044 | 0.076
0.000 | 0.000
0.000 | 0.000
0.645 | 0.695
0.252 | 0.278
0.000 | 0.000
1peptide
spectrum
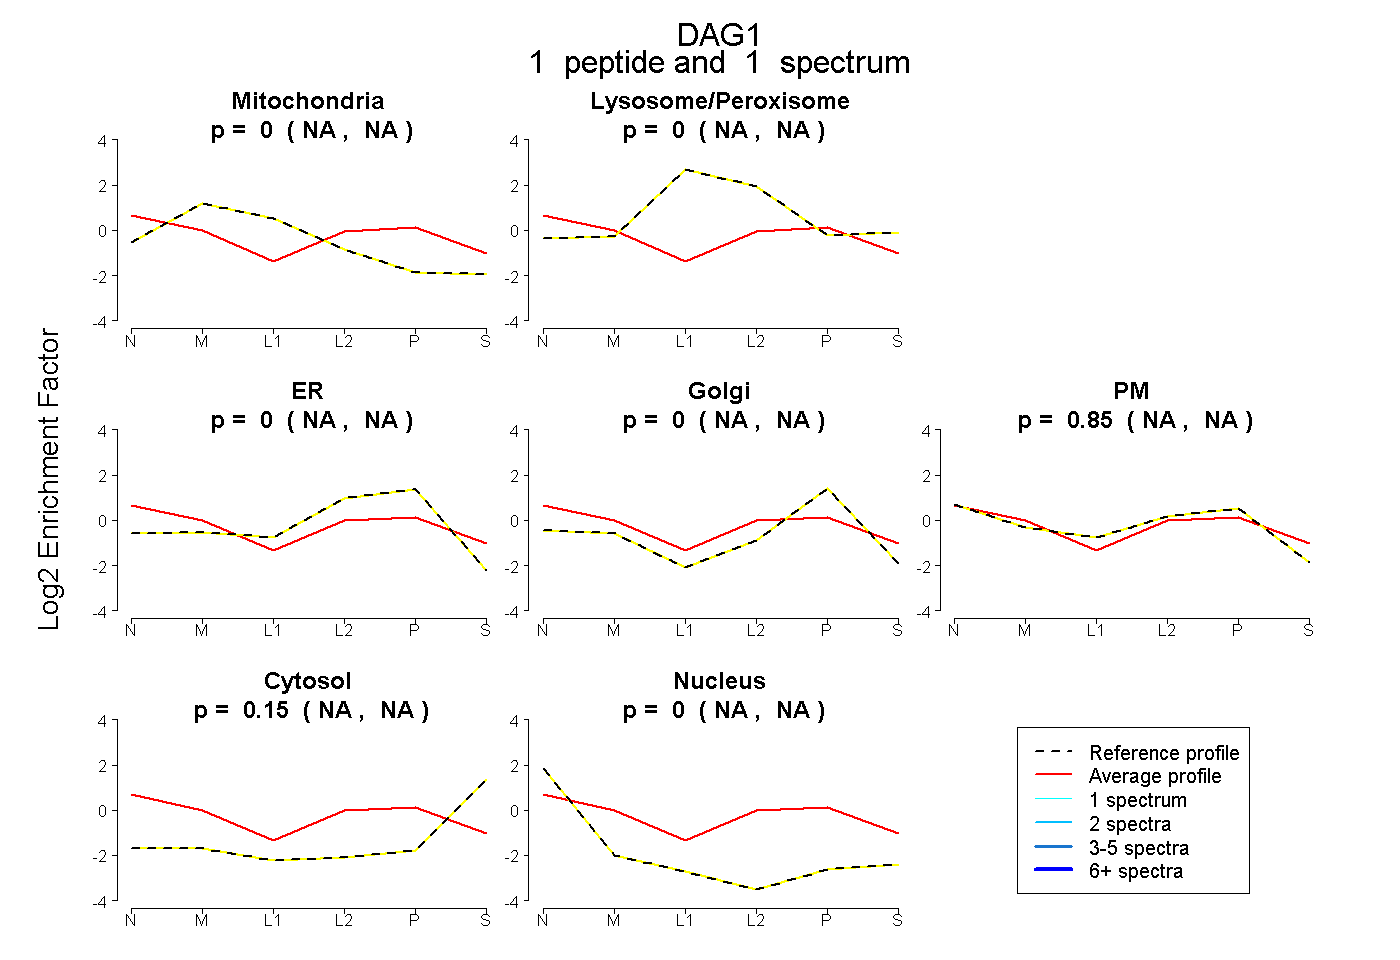
NA | NA
NA | NA
NA | NA
NA | NA
NA | NA
NA | NA
NA | NA
12peptides
spectra
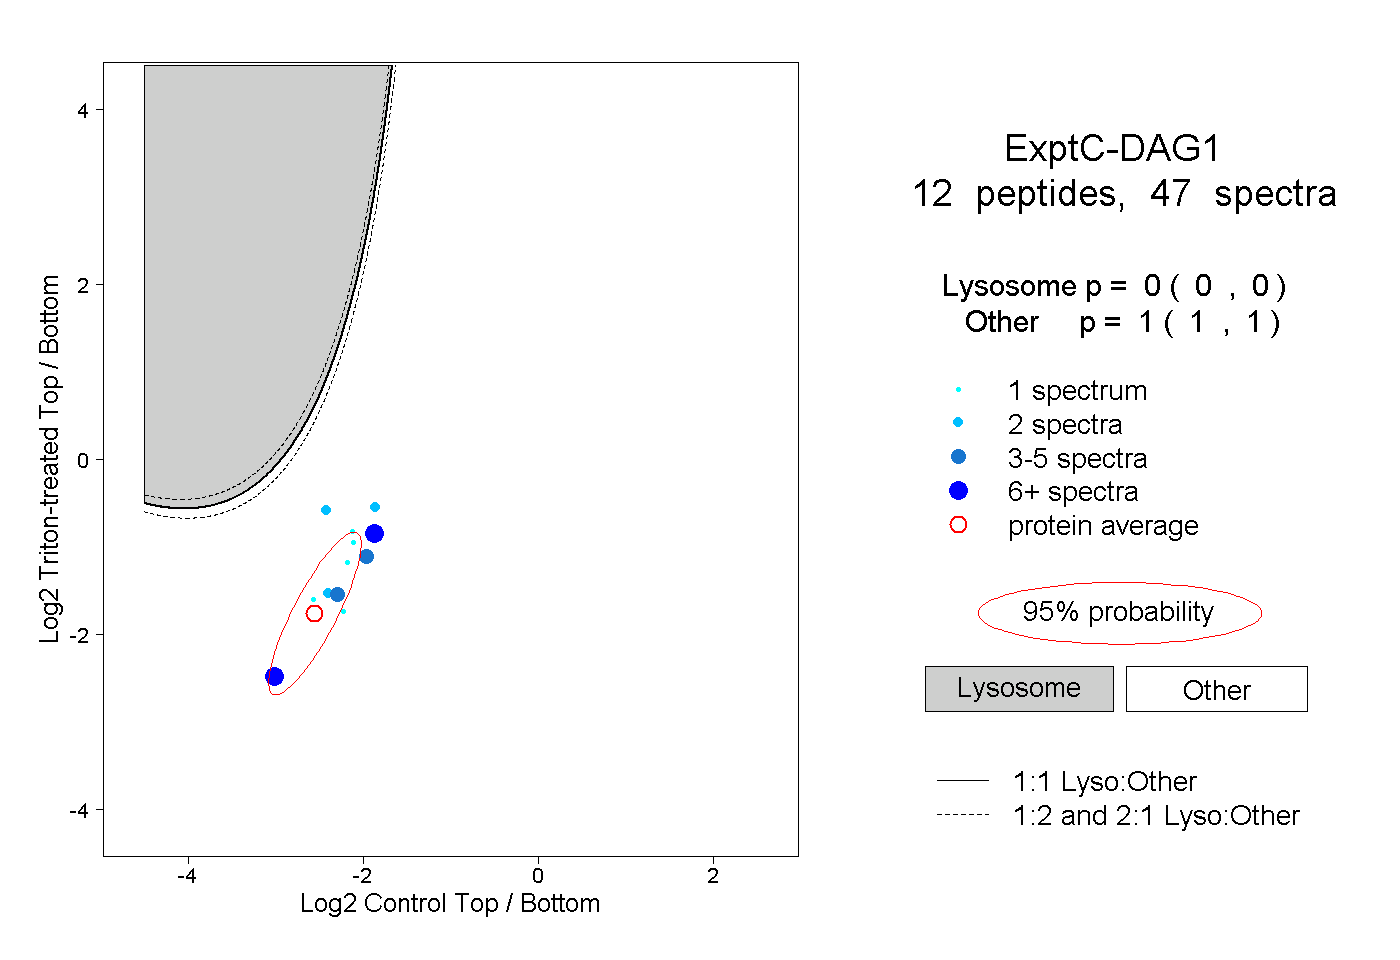
0.000 | 0.000
1.000 | 1.000
2peptides
spectra
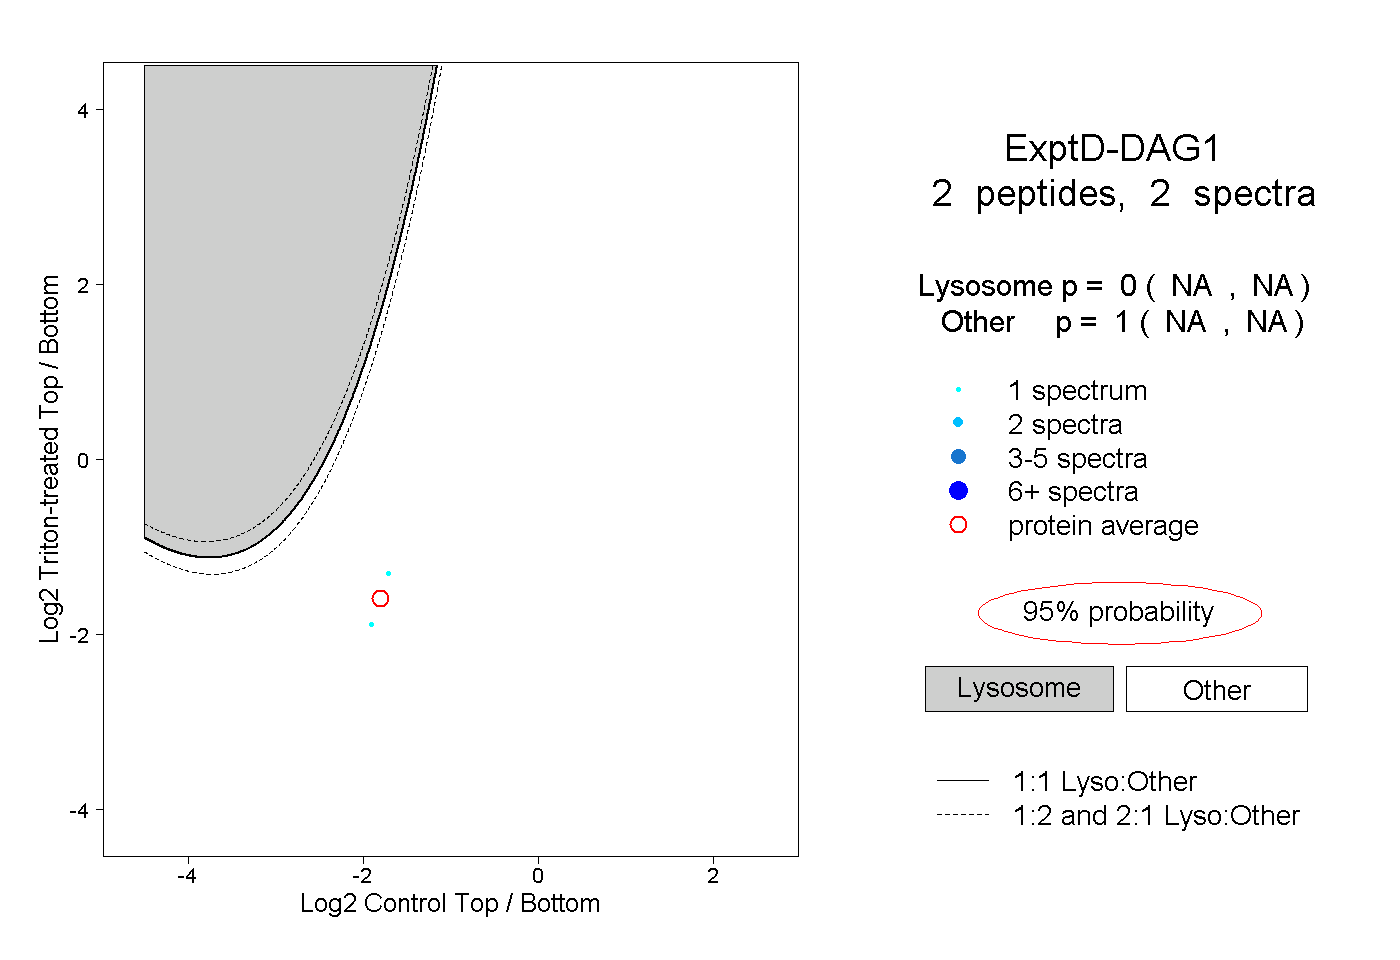
NA | NA
NA | NA