 12
12peptides
spectra
0.000 | 0.000
0.000 | 0.000
0.044 | 0.076
0.000 | 0.000
0.000 | 0.000
0.645 | 0.695
0.252 | 0.278
0.000 | 0.000
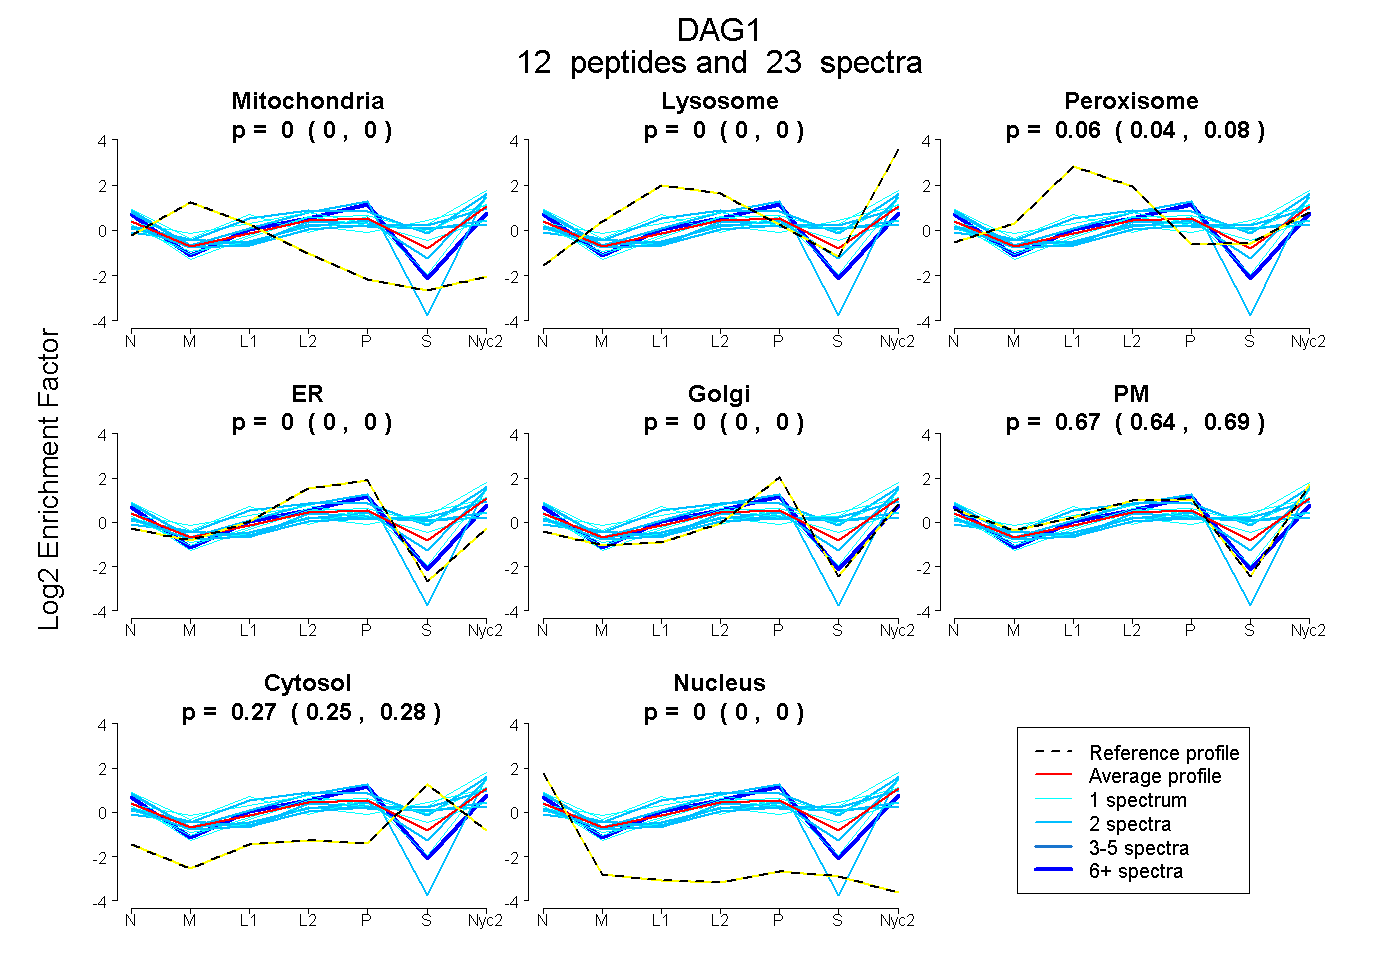
| Plot | Mito | Lyso | Perox | ER | Golgi | PM | Cytosol | Nucleus | |||||
| Expt A |
12 peptides |
23 spectra |
|
0.000 0.000 | 0.000 |
0.000 0.000 | 0.000 |
0.060 0.044 | 0.076 |
0.000 0.000 | 0.000 |
0.000 0.000 | 0.000 |
0.673 0.645 | 0.695 |
0.266 0.252 | 0.278 |
0.000 0.000 | 0.000 |
| 2 spectra, LTLEDQATFIK | 0.000 | 0.000 | 0.000 | 0.000 | 0.000 | 0.771 | 0.209 | 0.020 | ||
| 1 spectrum, LAGDPAPVVNDIHK | 0.000 | 0.237 | 0.000 | 0.000 | 0.000 | 0.397 | 0.365 | 0.000 | ||
| 1 spectrum, GGLSAVDAFEIHVHK | 0.020 | 0.000 | 0.281 | 0.034 | 0.000 | 0.431 | 0.234 | 0.000 | ||
| 1 spectrum, IALVK | 0.000 | 0.033 | 0.023 | 0.000 | 0.000 | 0.586 | 0.358 | 0.000 | ||
| 2 spectra, EQQLVGEK | 0.000 | 0.000 | 0.093 | 0.000 | 0.000 | 0.500 | 0.408 | 0.000 | ||
| 1 spectrum, LAFAFGDR | 0.000 | 0.123 | 0.039 | 0.000 | 0.000 | 0.376 | 0.463 | 0.000 | ||
| 6 spectra, ALSVAVAGSGSCR | 0.000 | 0.000 | 0.000 | 0.181 | 0.064 | 0.632 | 0.058 | 0.064 | ||
| 2 spectra, VDAWVGTYFEVK | 0.000 | 0.079 | 0.000 | 0.000 | 0.000 | 0.475 | 0.447 | 0.000 | ||
| 2 spectra, EQIVGLSR | 0.000 | 0.000 | 0.000 | 0.024 | 0.027 | 0.923 | 0.000 | 0.025 | ||
| 2 spectra, GGEANQRPELK | 0.013 | 0.000 | 0.116 | 0.000 | 0.000 | 0.446 | 0.424 | 0.000 | ||
| 1 spectrum, TPRPVPR | 0.001 | 0.080 | 0.103 | 0.000 | 0.000 | 0.712 | 0.000 | 0.105 | ||
| 2 spectra, GVETPAR | 0.000 | 0.248 | 0.131 | 0.000 | 0.033 | 0.370 | 0.217 | 0.000 |
| Plot | Mito | Lyso or Perox | ER | Golgi | PM | Cytosol | Nucleus | ||||||
| Expt B |
1 peptide |
1 spectrum |
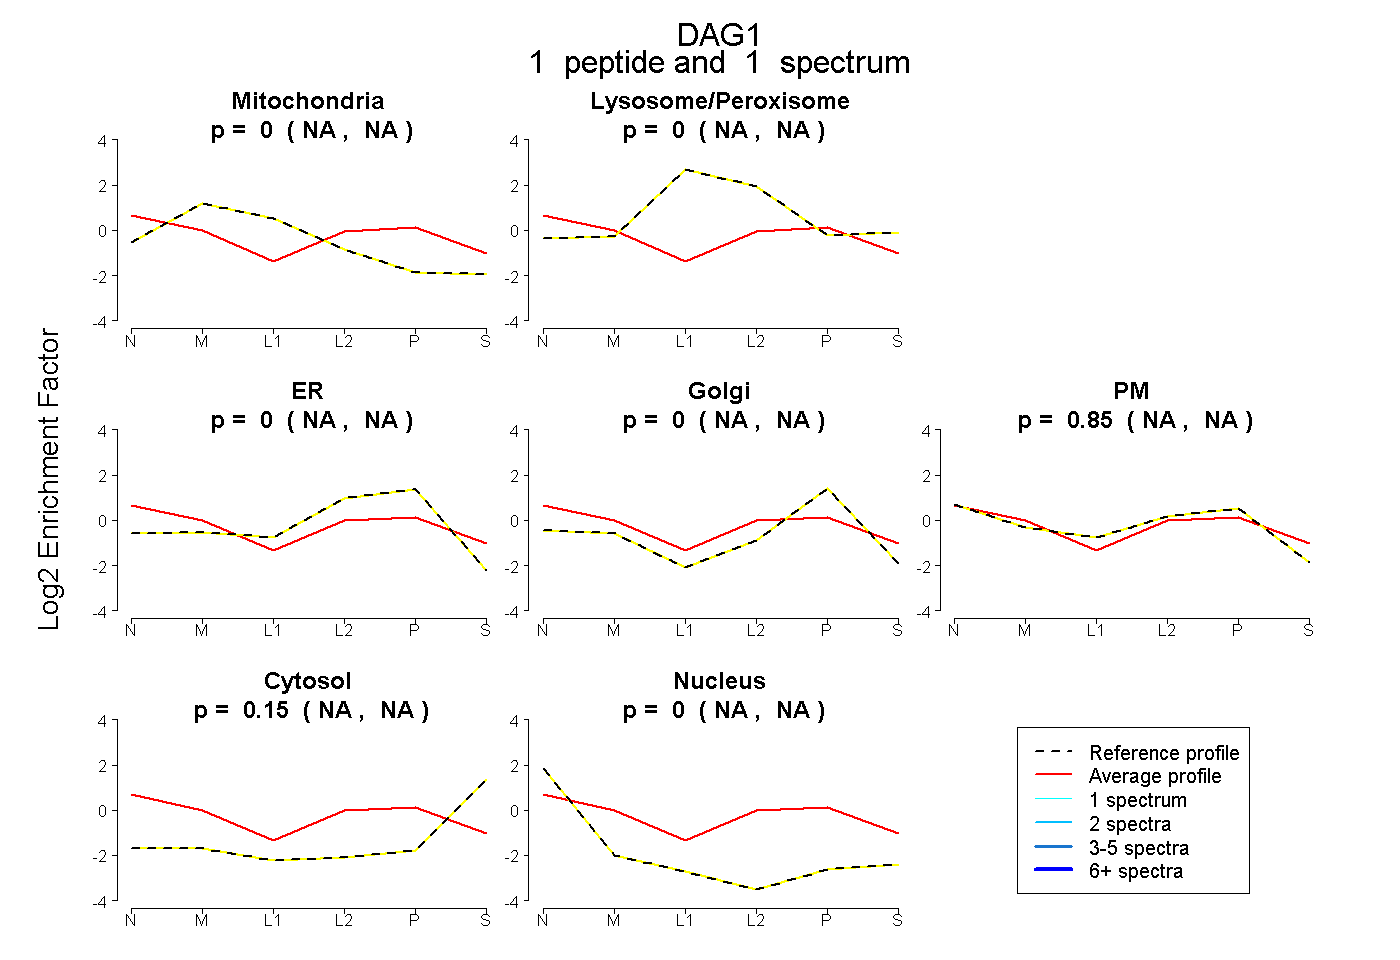 |
0.000 NA | NA |
0.000 NA | NA |
0.000 NA | NA |
0.000 NA | NA |
0.848 NA | NA |
0.152 NA | NA |
0.000 NA | NA |
|||
| Plot | Lyso | Other | |||||||||||
| Expt C |
12 peptides |
47 spectra |
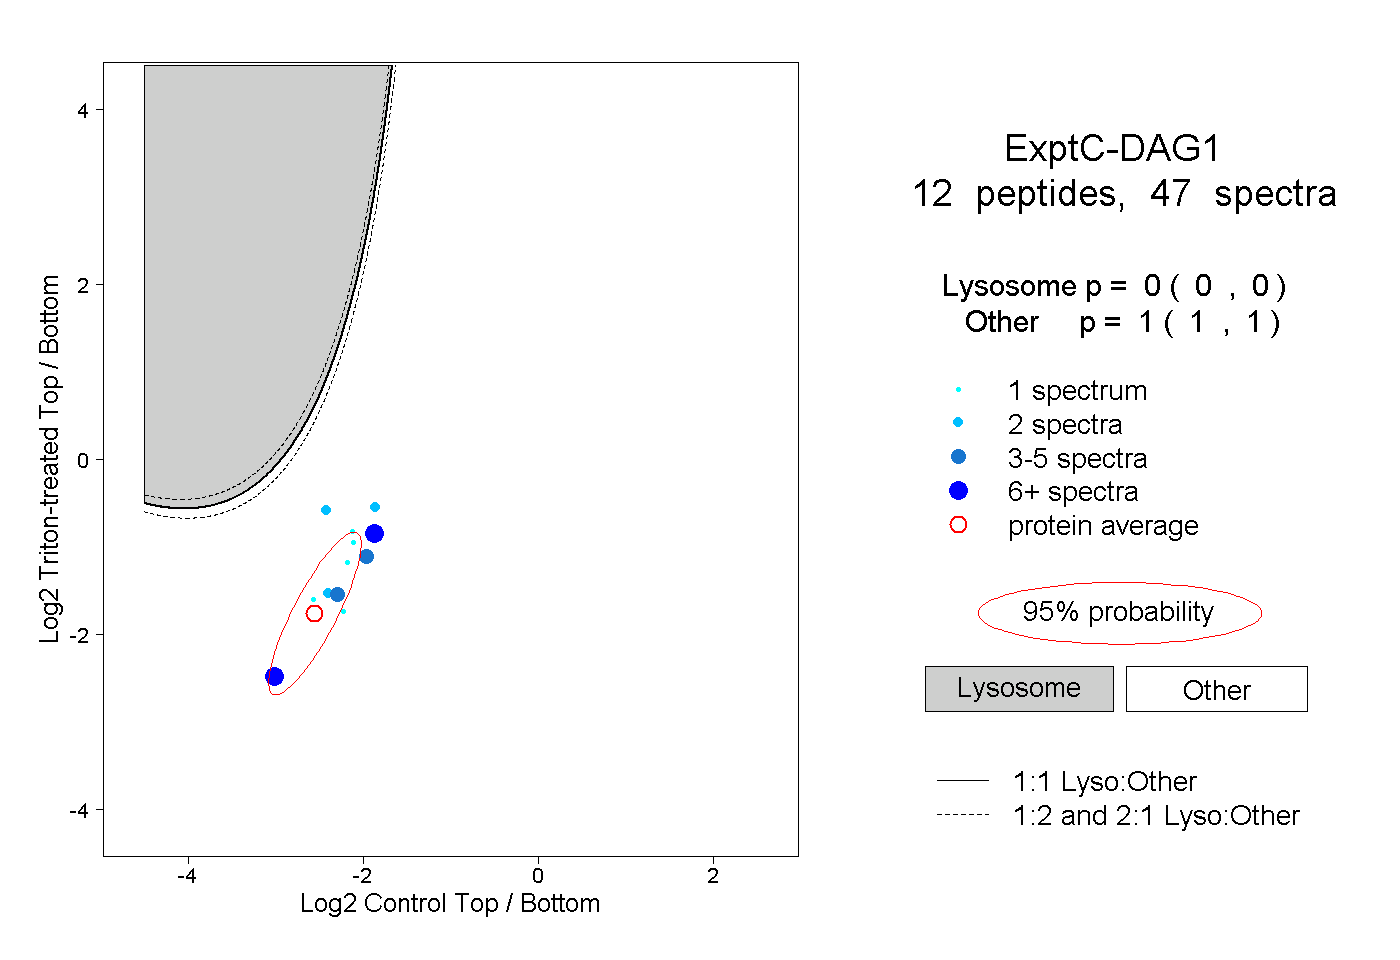 |
0.000 0.000 | 0.000 |
1.000 1.000 | 1.000 |
||||||||
| Plot | Lyso | Other | |||||||||||
| Expt D |
2 peptides |
2 spectra |
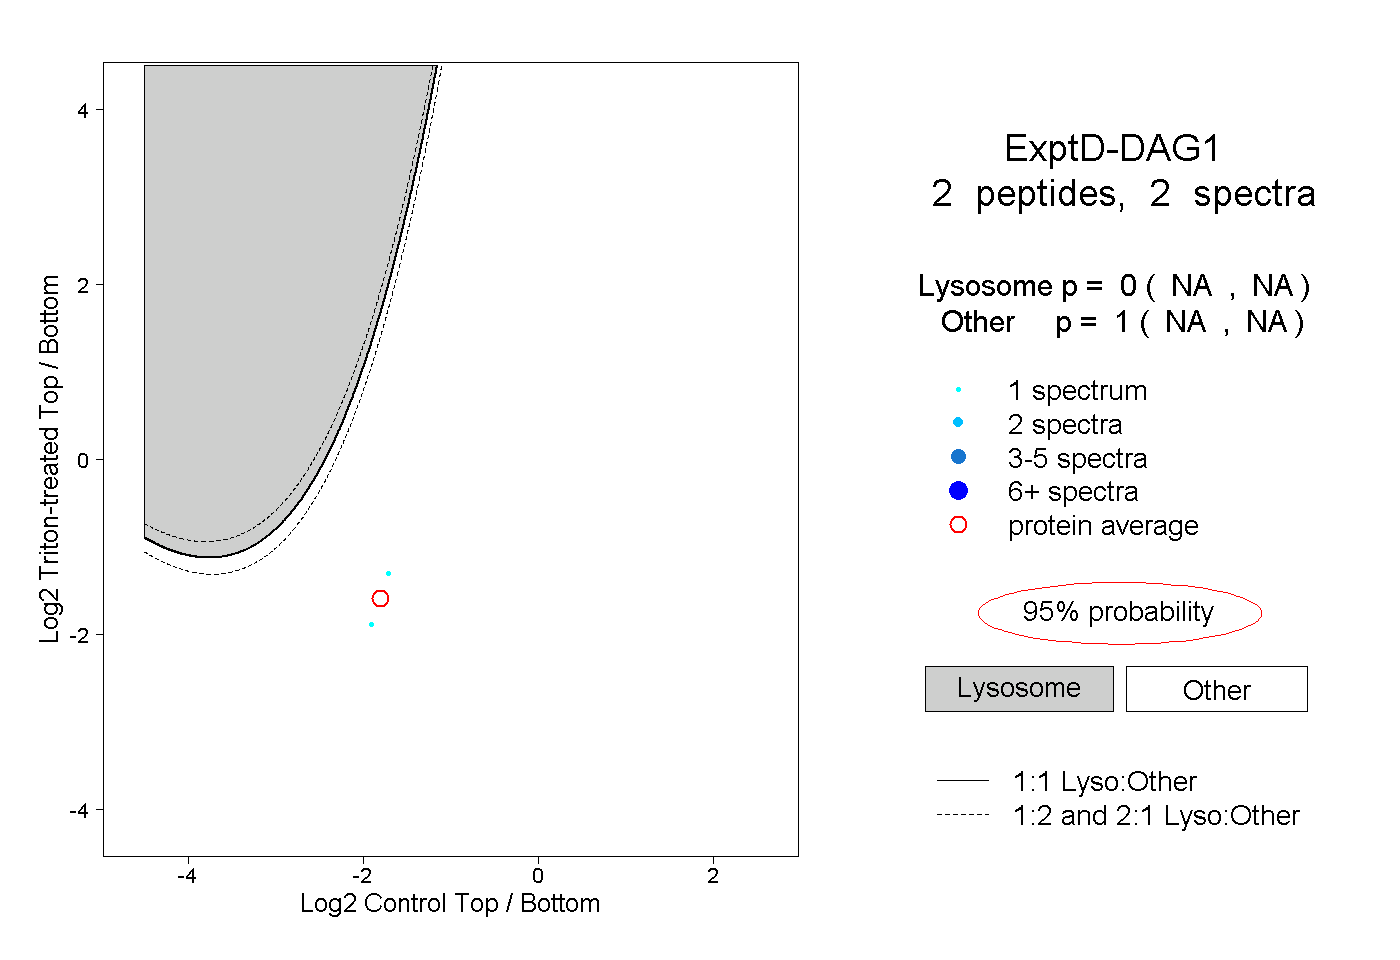 |
0.000 NA | NA |
1.000 NA | NA |