 13
13peptides
spectra
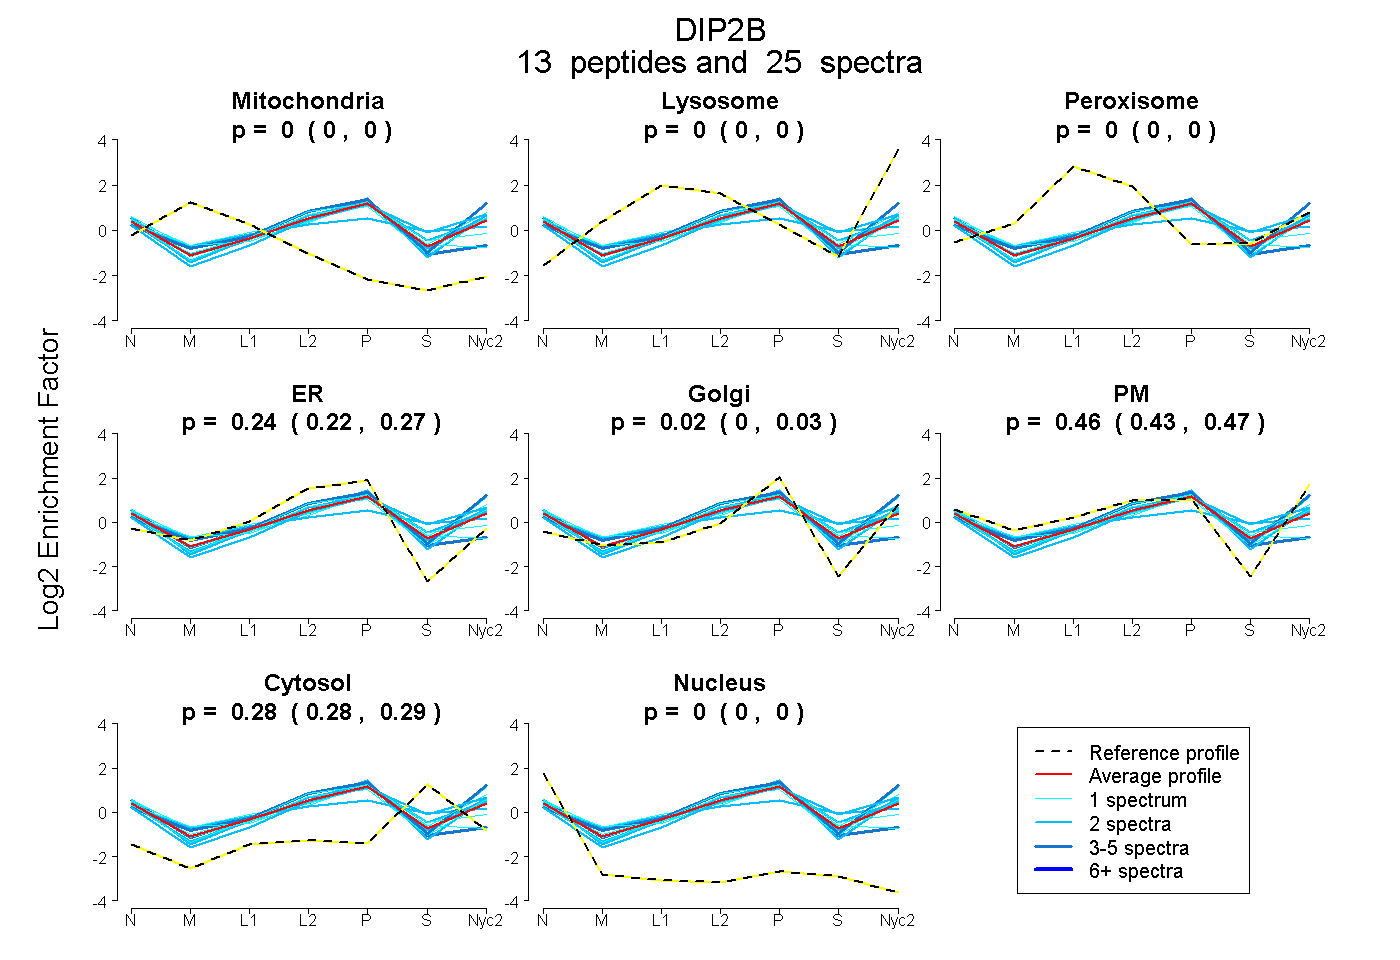
0.000 | 0.000
0.000 | 0.000
0.000 | 0.000
0.217 | 0.266
0.002 | 0.032
0.433 | 0.473
0.277 | 0.290
0.000 | 0.000
4peptides
spectra
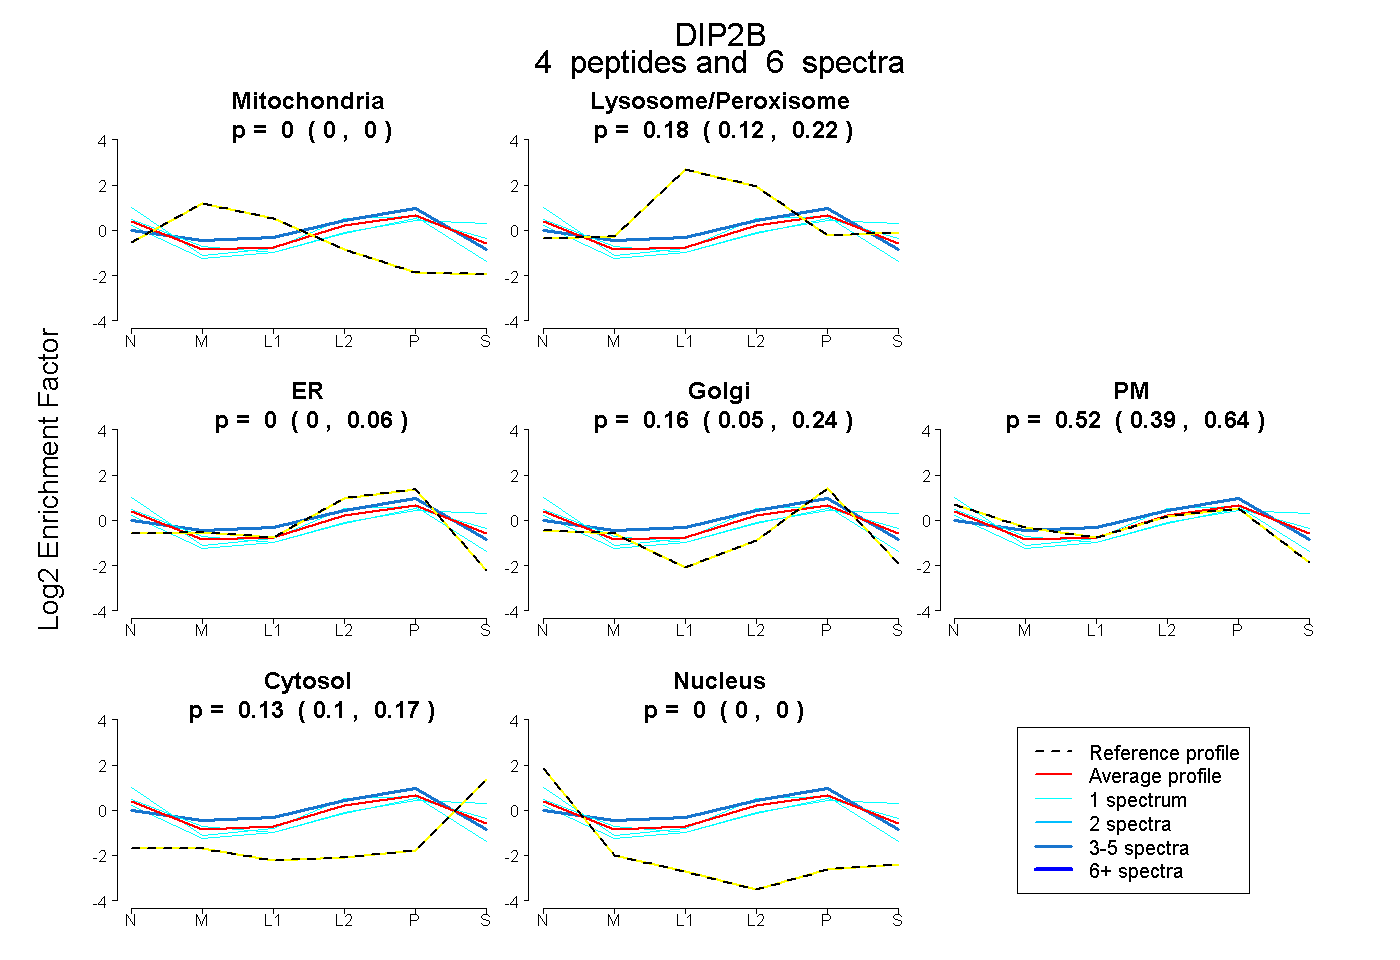
0.000 | 0.000
0.119 | 0.219
0.000 | 0.057
0.049 | 0.239
0.394 | 0.637
0.096 | 0.167
0.000 | 0.000
15peptides
spectra

0.000 | 0.000
1.000 | 1.000