 13
13peptides
spectra
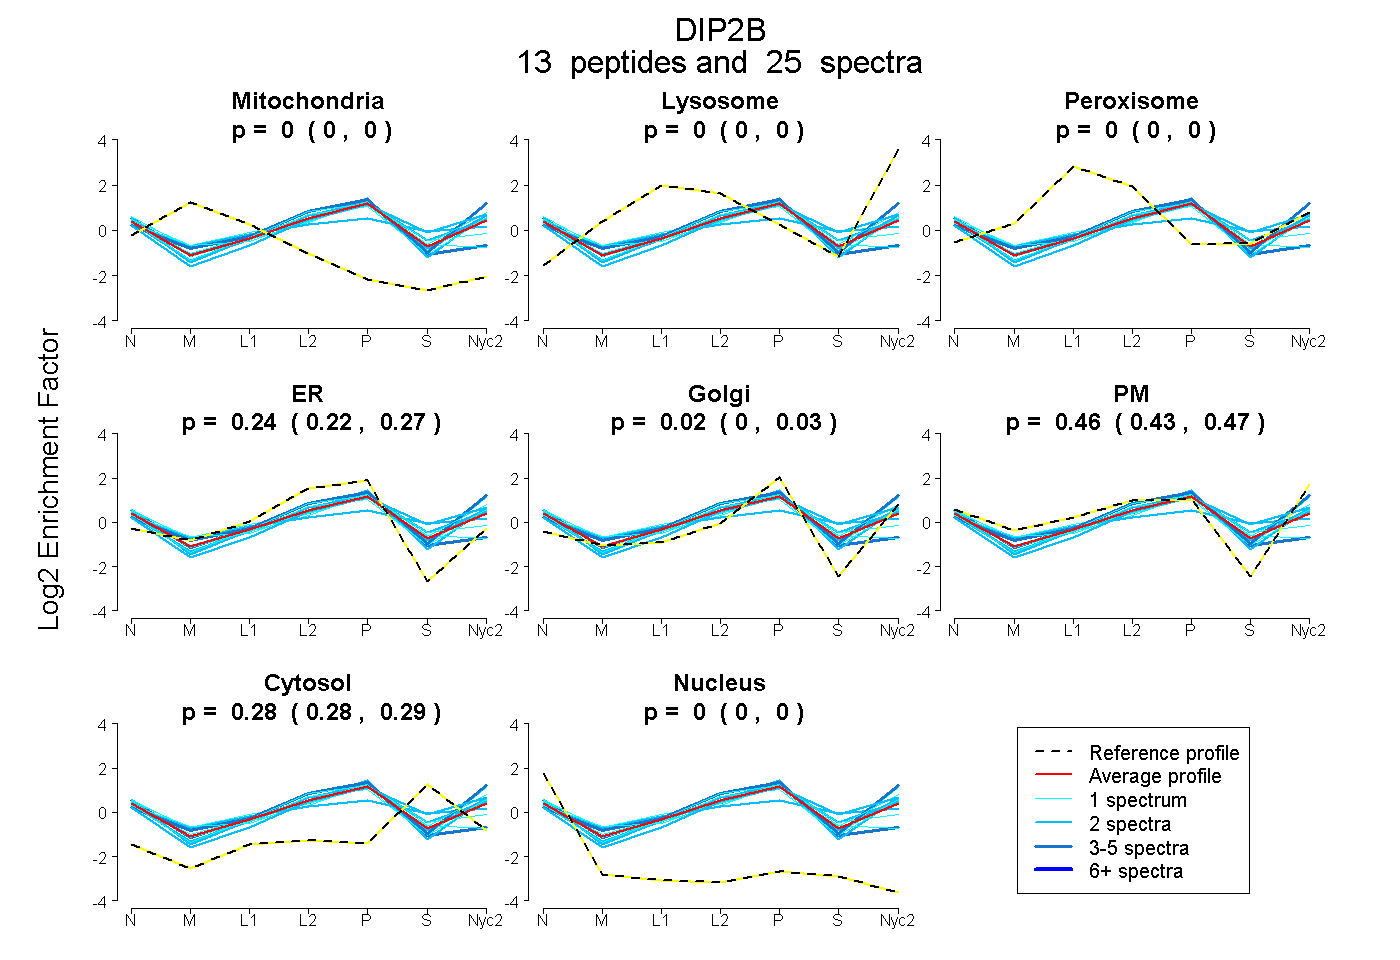
0.000 | 0.000
0.000 | 0.000
0.000 | 0.000
0.217 | 0.266
0.002 | 0.032
0.433 | 0.473
0.277 | 0.290
0.000 | 0.000
| Plot | Mito | Lyso | Perox | ER | Golgi | PM | Cytosol | Nucleus | |||||
| Expt A |
13 peptides |
25 spectra |
|
0.000 0.000 | 0.000 |
0.000 0.000 | 0.000 |
0.000 0.000 | 0.000 |
0.243 0.217 | 0.266 |
0.018 0.002 | 0.032 |
0.455 0.433 | 0.473 |
0.284 0.277 | 0.290 |
0.000 0.000 | 0.000 |
| 1 spectrum, TCPLSWVQR | 0.000 | 0.000 | 0.033 | 0.023 | 0.147 | 0.541 | 0.255 | 0.000 | ||
| 1 spectrum, IVVVAEQRPDASEEDSFQWMSR | 0.000 | 0.000 | 0.000 | 0.155 | 0.114 | 0.490 | 0.240 | 0.000 | ||
| 4 spectra, AACVLTTQTLMR | 0.000 | 0.000 | 0.010 | 0.595 | 0.000 | 0.108 | 0.225 | 0.061 | ||
| 1 spectrum, DLGQIEENDLVR | 0.000 | 0.000 | 0.031 | 0.159 | 0.058 | 0.535 | 0.217 | 0.000 | ||
| 2 spectra, DIGLSPR | 0.000 | 0.000 | 0.000 | 0.179 | 0.083 | 0.480 | 0.258 | 0.000 | ||
| 1 spectrum, TDEIGEICVSSR | 0.000 | 0.000 | 0.026 | 0.454 | 0.000 | 0.206 | 0.314 | 0.000 | ||
| 1 spectrum, IASVLGDK | 0.000 | 0.000 | 0.000 | 0.000 | 0.037 | 0.754 | 0.209 | 0.000 | ||
| 1 spectrum, LQCELYSSR | 0.000 | 0.000 | 0.000 | 0.587 | 0.000 | 0.061 | 0.327 | 0.024 | ||
| 2 spectra, EGSVMGVTVSR | 0.000 | 0.000 | 0.000 | 0.251 | 0.005 | 0.430 | 0.314 | 0.000 | ||
| 2 spectra, AVSTTFGSR | 0.000 | 0.000 | 0.000 | 0.163 | 0.195 | 0.446 | 0.196 | 0.000 | ||
| 2 spectra, MSHSAVNALCR | 0.000 | 0.000 | 0.126 | 0.093 | 0.000 | 0.395 | 0.386 | 0.000 | ||
| 5 spectra, RPGVPGAPLPGR | 0.000 | 0.068 | 0.000 | 0.093 | 0.130 | 0.536 | 0.173 | 0.000 | ||
| 2 spectra, TWPAIIDTDDLPR | 0.000 | 0.000 | 0.000 | 0.087 | 0.102 | 0.438 | 0.373 | 0.000 |
| Plot | Mito | Lyso or Perox | ER | Golgi | PM | Cytosol | Nucleus | ||||||
| Expt B |
4 peptides |
6 spectra |
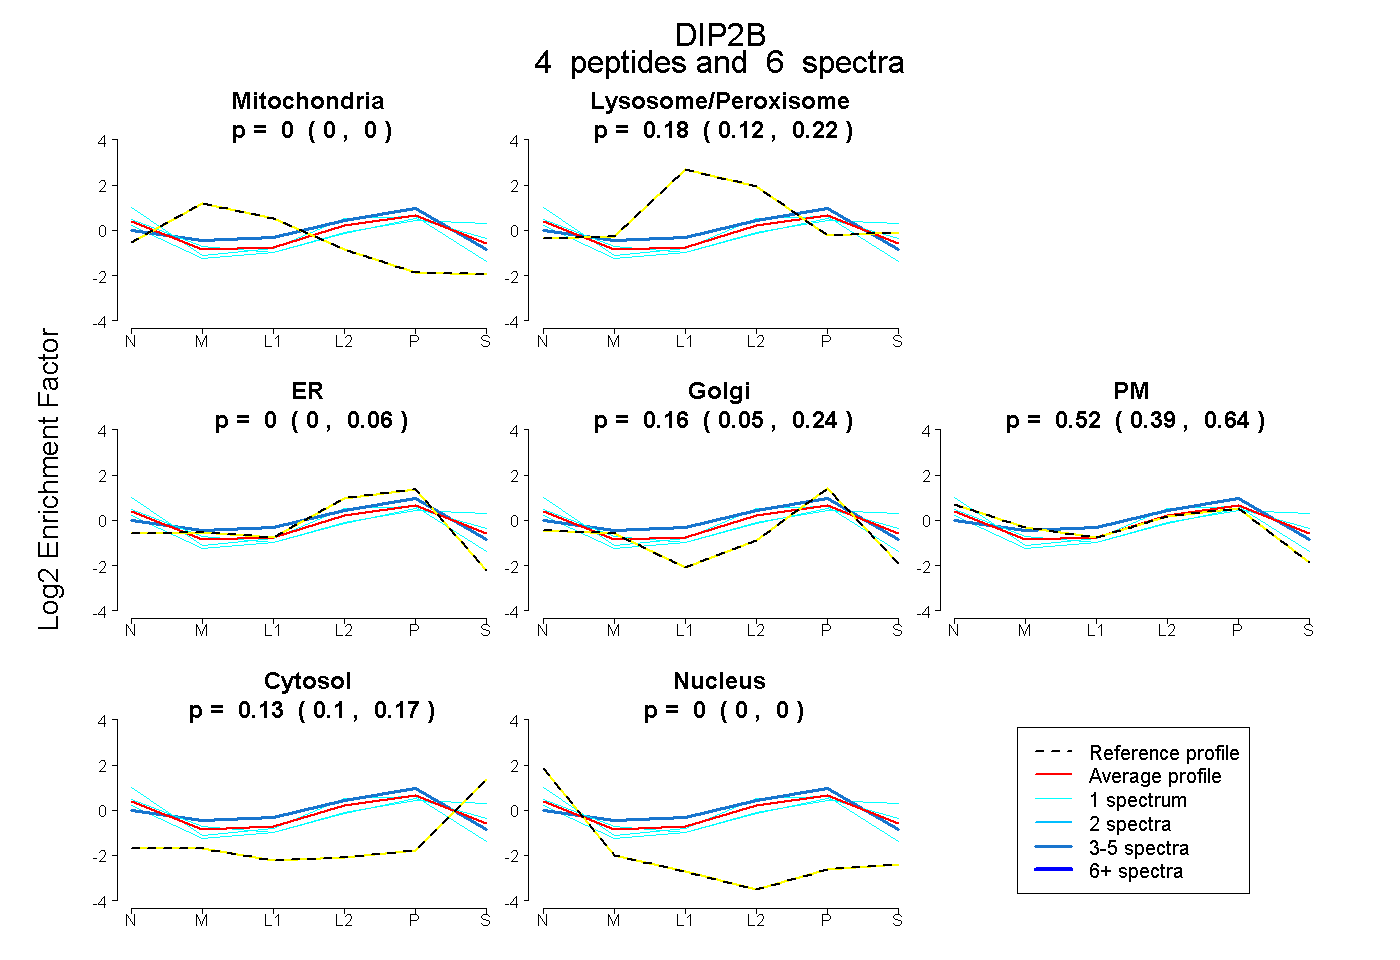 |
0.000 0.000 | 0.000 |
0.180 0.119 | 0.219 |
0.000 0.000 | 0.057 |
0.163 0.049 | 0.239 |
0.522 0.394 | 0.637 |
0.135 0.096 | 0.167 |
0.000 0.000 | 0.000 |
|||
| Plot | Lyso | Other | |||||||||||
| Expt C |
15 peptides |
25 spectra |
 |
0.000 0.000 | 0.000 |
1.000 1.000 | 1.000 |